To understand the bits and bytes of the data architecture one must first get a little overview of what data architecture is?
Data architecture is the steps of construction or framework that contains different models, rules, laws, standards, and policies that tell us what type of data we should collect, process, trim, store, or integrate and that letter would be used by the organizations by means of their data systems.
The data architecture also tells us the structure of the firm's physical and logical data assets and the resources that manage data. Data architecture is set to translate the business requirements into data and system's requirements and also tells us the way how it would be managed throughout the data life cycle.
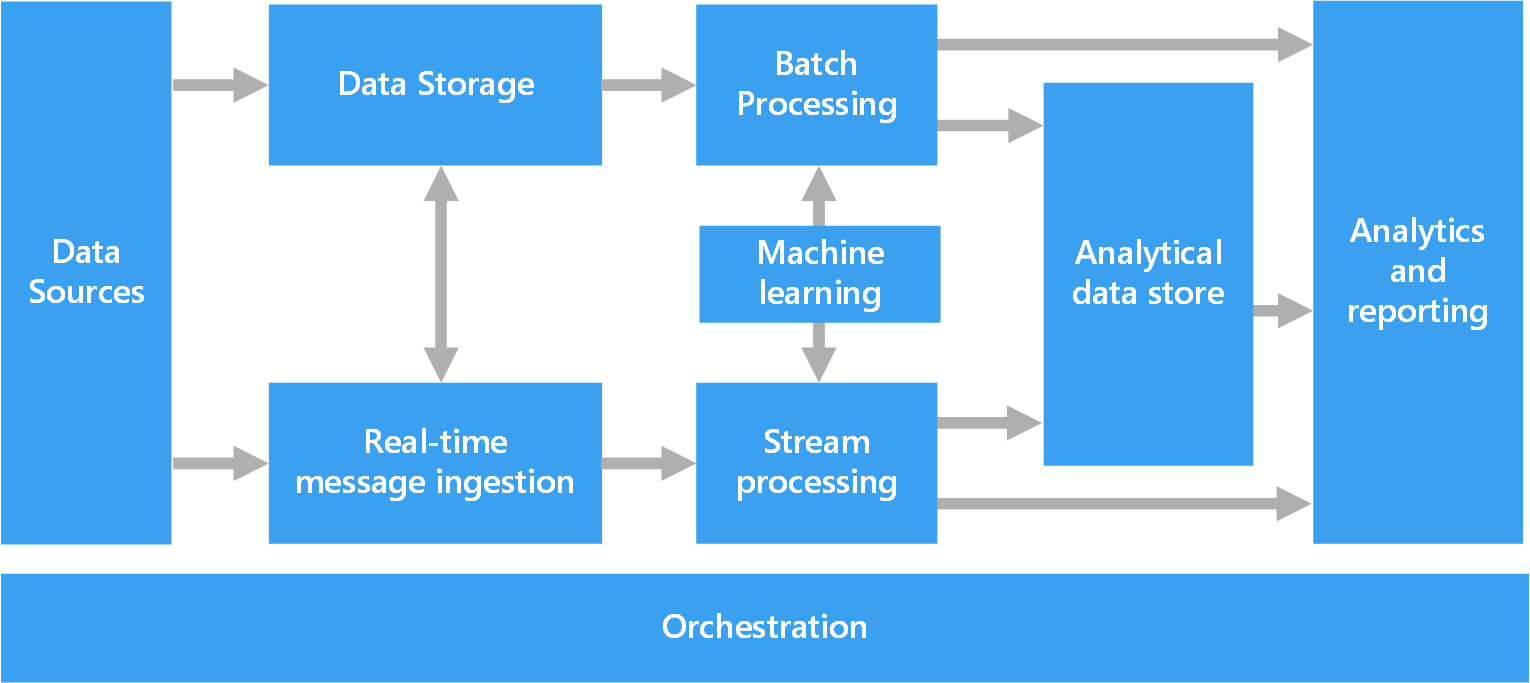
Image Source: docs.microsoft.com
What is a Data Architecture Diagram?
The concept of the architectural diagram is the same for the data too as it is the same for the buildings, floors, applications, clouds, etc.
The data architecture diagram is the diagrammatic representation of how the data is managed throughout the whole data life from consuming to disposing of securely.
In the data architecture diagram, the components are shown and arranged and communicate with each other for processing the data.
The point can be made more concrete by understanding the diagram that is pinned above. It is the clearest diagram of the data architecture.
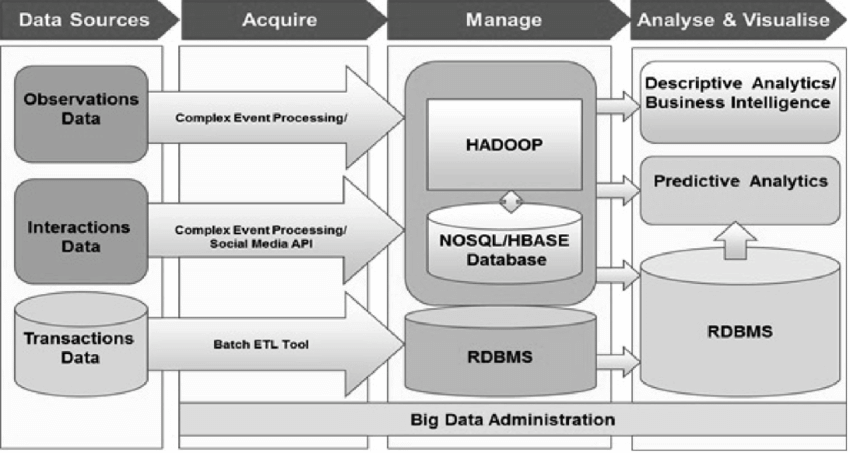
Image Source: www.researchgate.net
From the data sources section, we are getting different types of data like transaction, interaction, observation then this data is acquired using different tools, platforms, and APIs and then stored and managed in the big databases.
Then this data is again retrieved from the databases from where different models are applied to it to extract the meaningful information. The data architecture can be more complex and include hundreds of components but this diagram is small and easy to get in mind.
Benefits of Using Data Architecture Diagrams
There are dozens of benefits of using the data architecture diagrams and so some of the main advantages are listed below.
Better understanding
Data architecture diagrams help you to get a better understanding of data and how to manage it when it is on your premises.
Guidelines for data managing
Data architecture diagrams give you the guidelines and policies of how you would manage the data securely and hence saving you from the wrath of the regulatory bodies.
Generate business intelligence
Data architecture diagrams help you to quickly get the business intelligence from the data without getting stuck in any clutter of data. As you continuously generate the BI you sell it to get the profits.
Provide vision
Data architecture diagrams make everyone stand on the same point, ease the communication and collaboration and provide a clear vision onto the data.
Components in Data Architecture
The data architecture has the three components namely.
- Data Lake
- Data Warehouse
- Data Mart
These components are described below.
Some of the Do's and Don'ts provided by the Azure documentation for icons are listed below.
Data Lake
Data lake is the platform, storage, or place where the data is stored in its natural raw form before getting processed. It is the most sensitive part of the data lifecycle in the firm as the firm starts to get the data from the lake to process it.
The industrial experts and regulatory bodies urge to only process the data that is needed otherwise it will create a lot of problems while managing it.
Data Warehouse
It is the station where the data is stored in the structured and in a modeled format. In most cases data in the data warehouse is stored in the tabular format and ready for its final and useful use.
Data Mart
It is the place from which data is ready to use, share, or sell. The data is obtained hereafter in many processing cycles and finally in the business intelligence format. Data Mart is also the place where multiple regulatory rules are also applied before sharing the intelligence further.
Data Architecture Diagram Examples
To understand more, below are some practical examples of the data architecture diagrams.
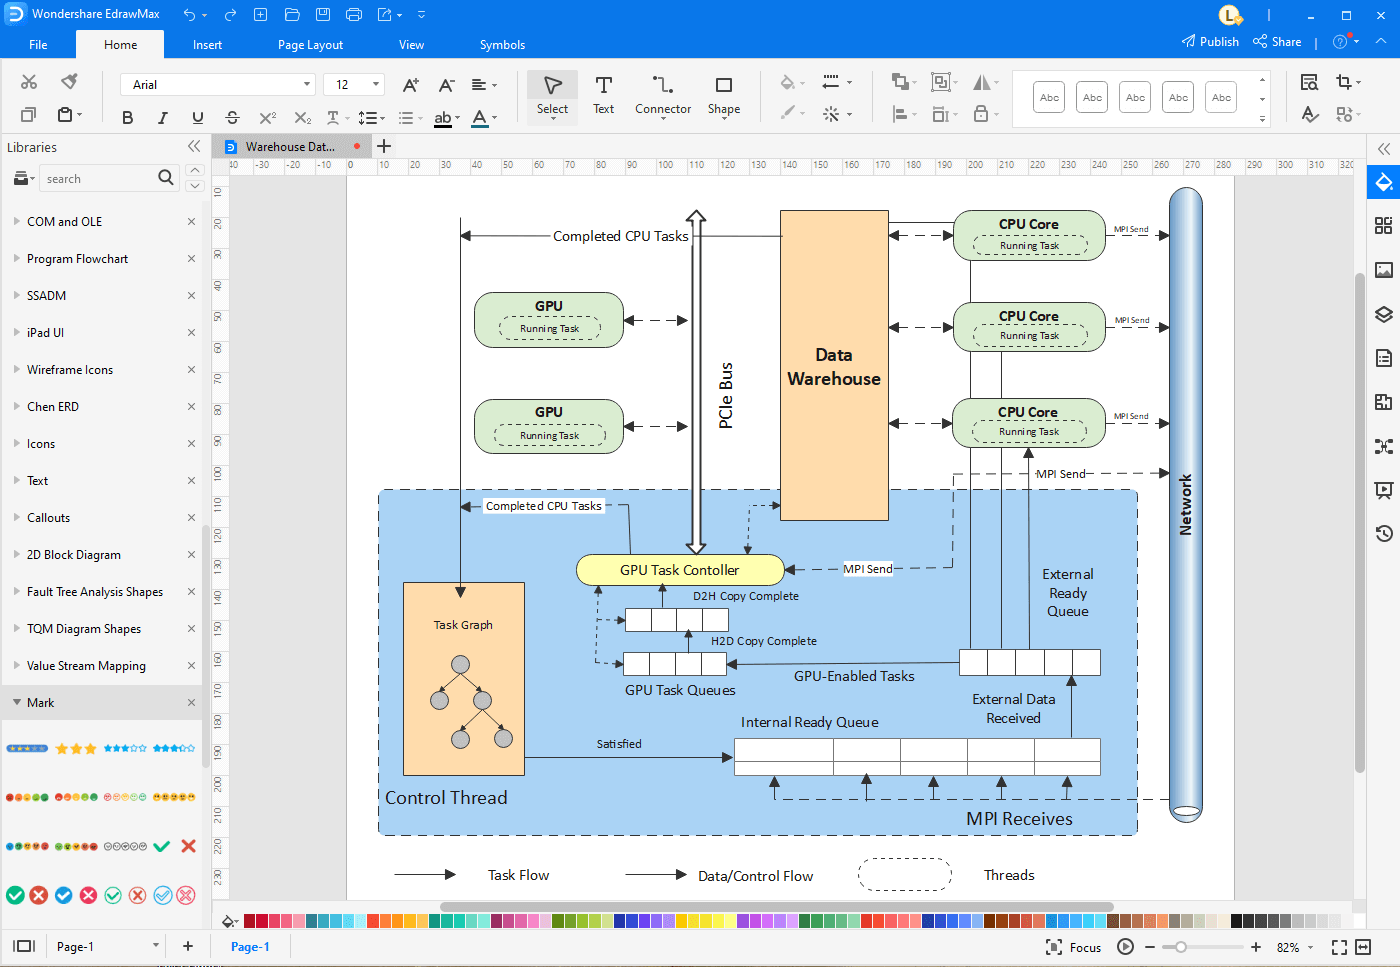
Example 1: Warehouse Data Architecture Diagram
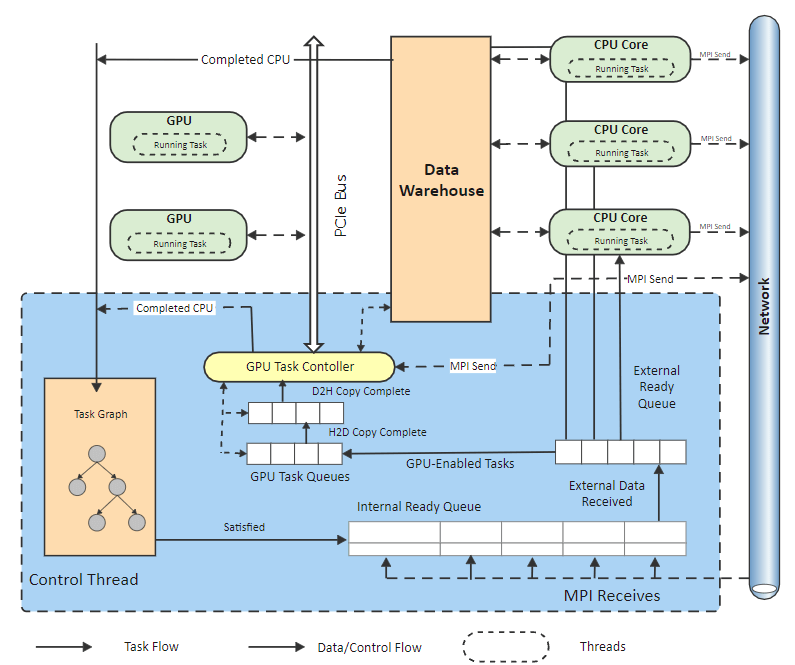
Data warehouse architecture diagram is designed for processing and computing the data when it is in the data warehouse.
It is the place where the data is retrieved from the previous position, transformed to the intelligence the business wants and then transformed into the data marts from where it would be shared.
So, it is necessary to design the data warehouse architecture diagrams according to the subject of how you want the data to look like. The diagram will include all the components to process and transform the data like CPU or GPU as shown in the above diagram.
Example 2: Big Data Architecture Diagram
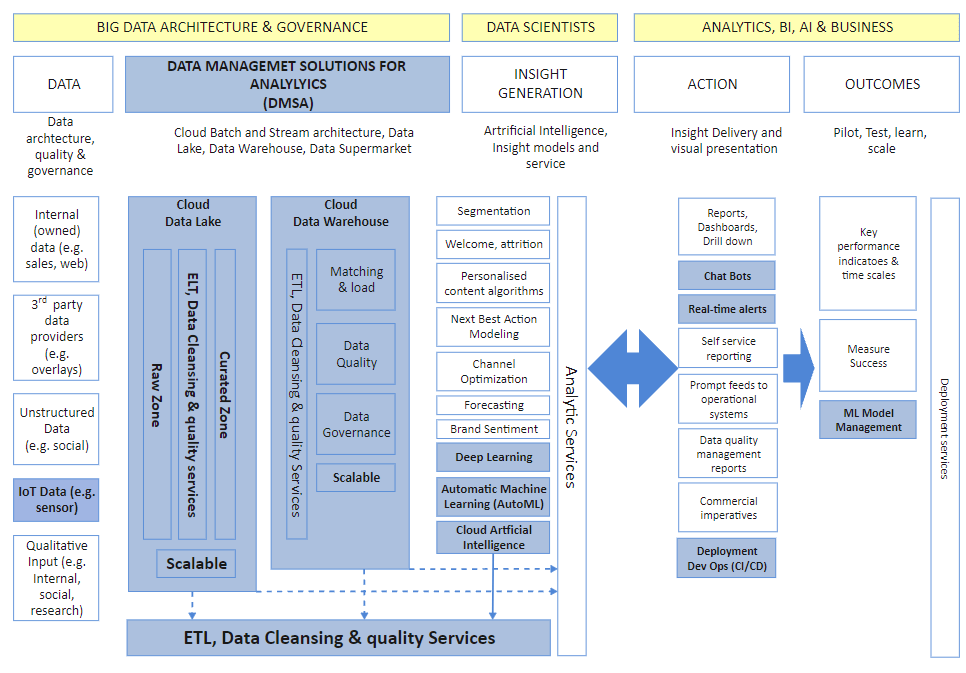
The big data architecture paves the way for the analytics teams to get meaningful data from big data. It's like a system or platform that provides the tools and guidelines to manage a large amount of data so further it can be extracted into analytics and intelligence. Not only managing data, but it also gives you the environment where you use the tools to get meaningful information from the big data clutter.
The big data architecture can be different depending on the business logic so, the architecture diagram is made according to the requirements. This architecture diagram clearly shows that the business logic can be of the IT services providing enterprise. So, it has all the components like cloud, AI, ML, etc.
Example 3: Hadoop Data Lake Business Architecture Diagram
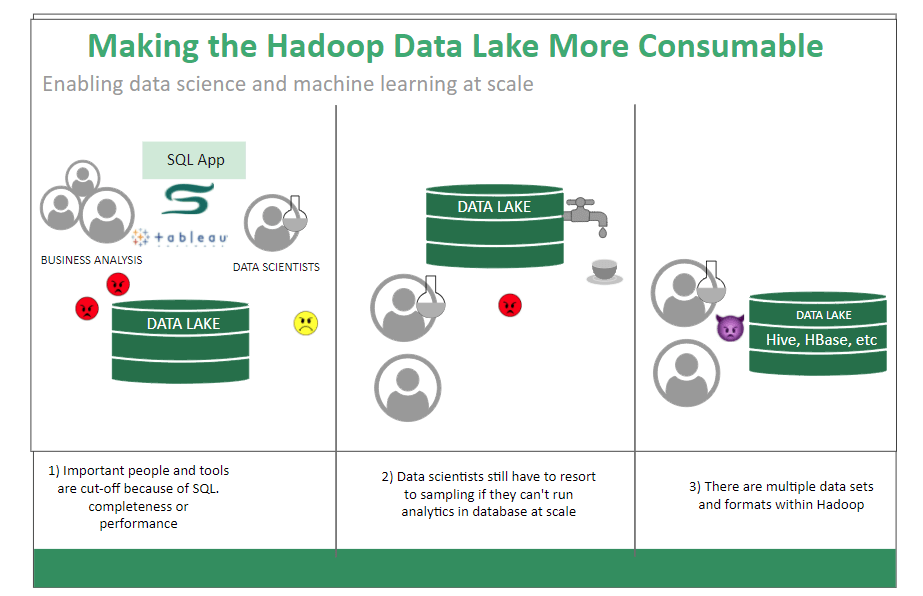
Hadoop is an open-source data computation software. It is the place where the data is retrieved in the original format and hence different components are set up here to set it into structured or modeled format for the next destination.
The architecture diagram is designed to manage the data in the lake and transform the meaningful information to store it in the data warehouse.
EdrawMax
All-in-One Diagram Software
- Superior file compatibility: Import and export drawings to various file formats, such as Visio
- Cross-platform supported (Windows, Mac, Linux, Web)
How to Create a Data Architecture Diagram?
Step 1: Download EdrawMax and launch on the desktop or open EdrawMax Online on the browser. Navigate to [Software & Database] > [Software Development].
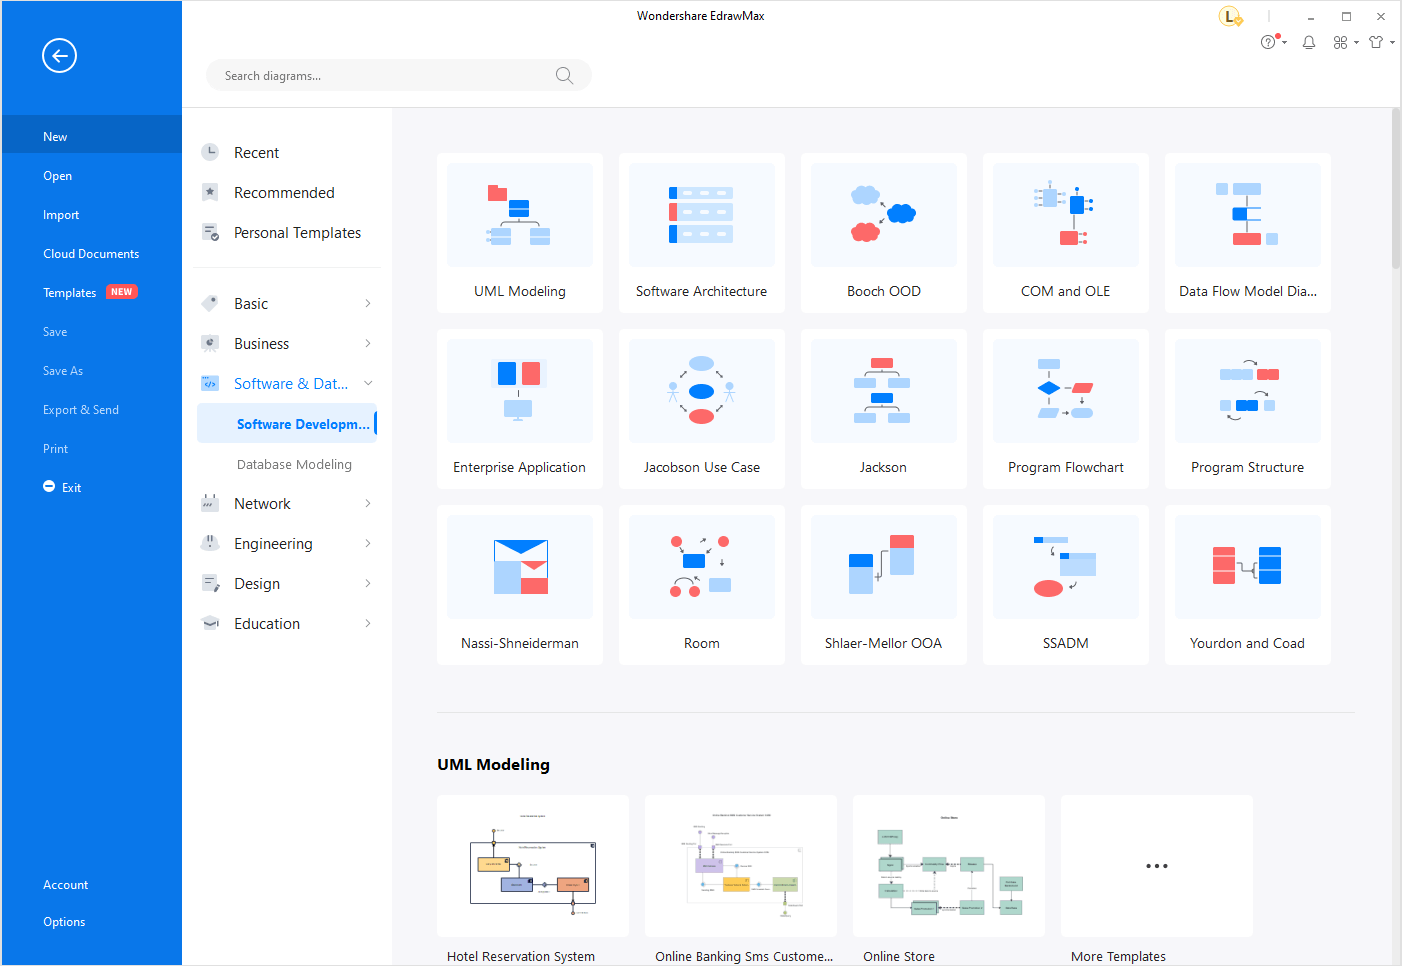
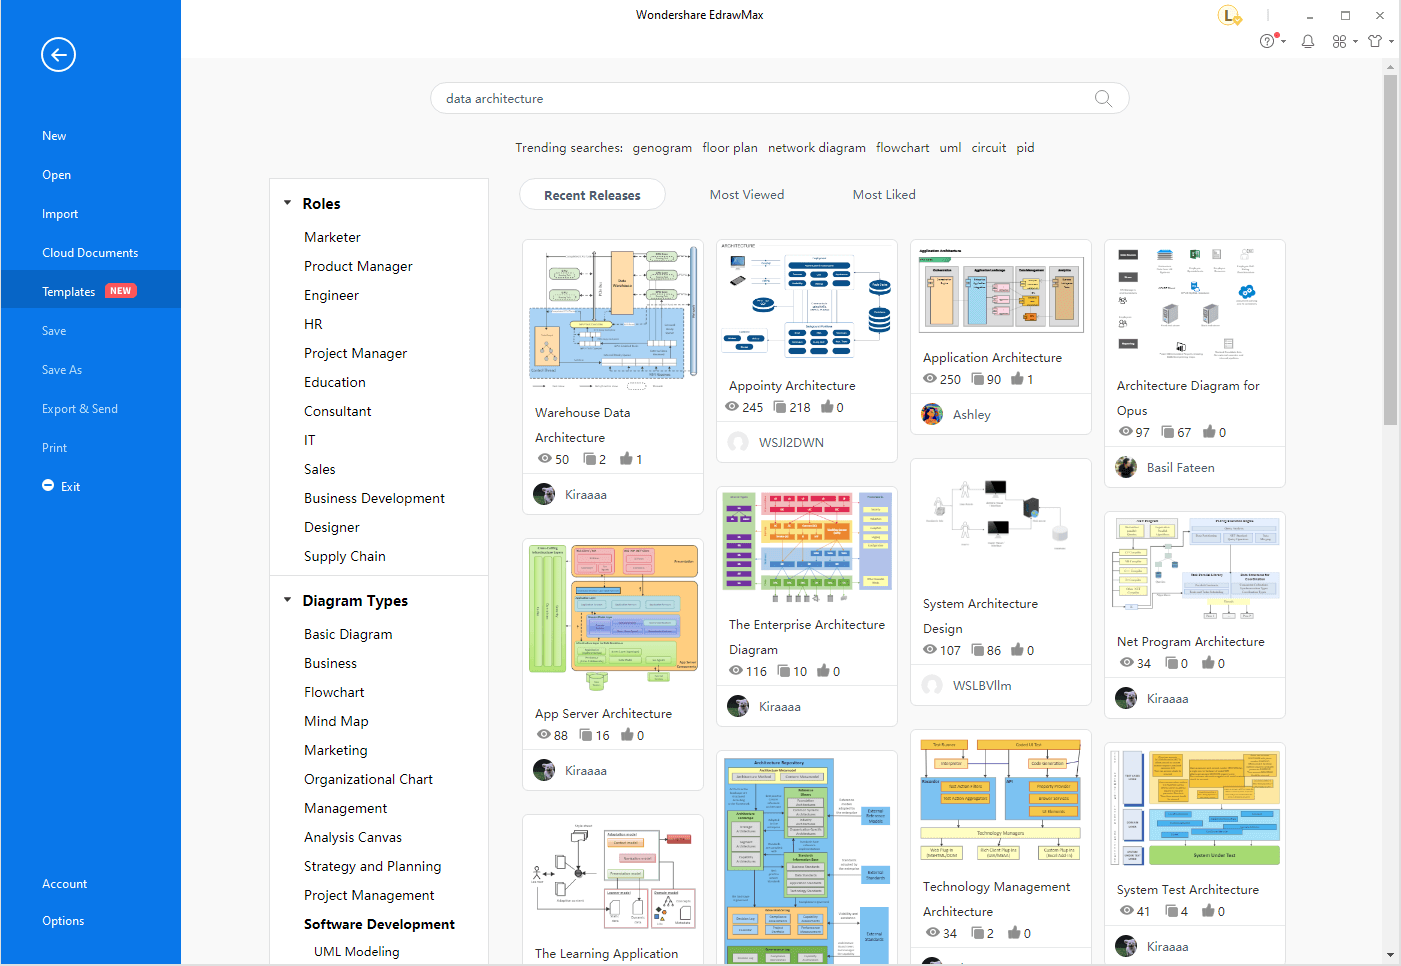
Click [Templates] on the File menu and you can see a great number of architecture diagram templates in the Template Community. Create diagrams quickly and easily by getting started with the pre-designed templates.
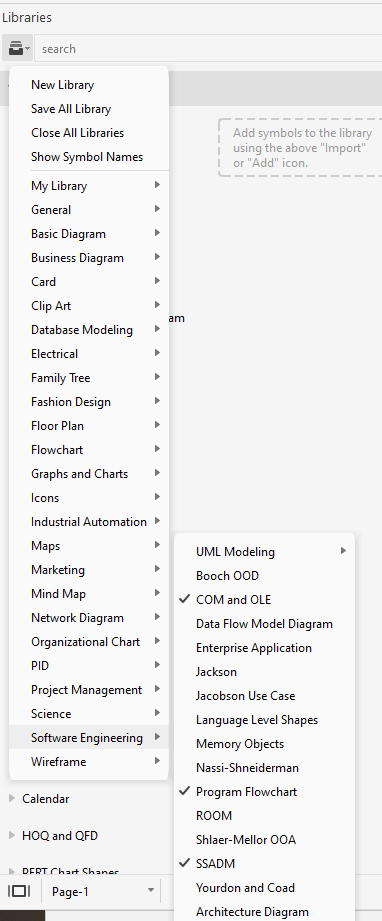
Step 2: Open the menu of [Libraries]. Select symbols for drawing data architecture diagrams. Drag and drop the symbols on the canvas. The alignment and position tools in EdrawMax can help you arrange the symbols quickly.
Step 3: Design the architecture with Edraw's formatting and editing tools effortlessly. With fully customizable diagramming capabilities, EdrawMax makes it easier than ever to build out the data architecture diagrams.
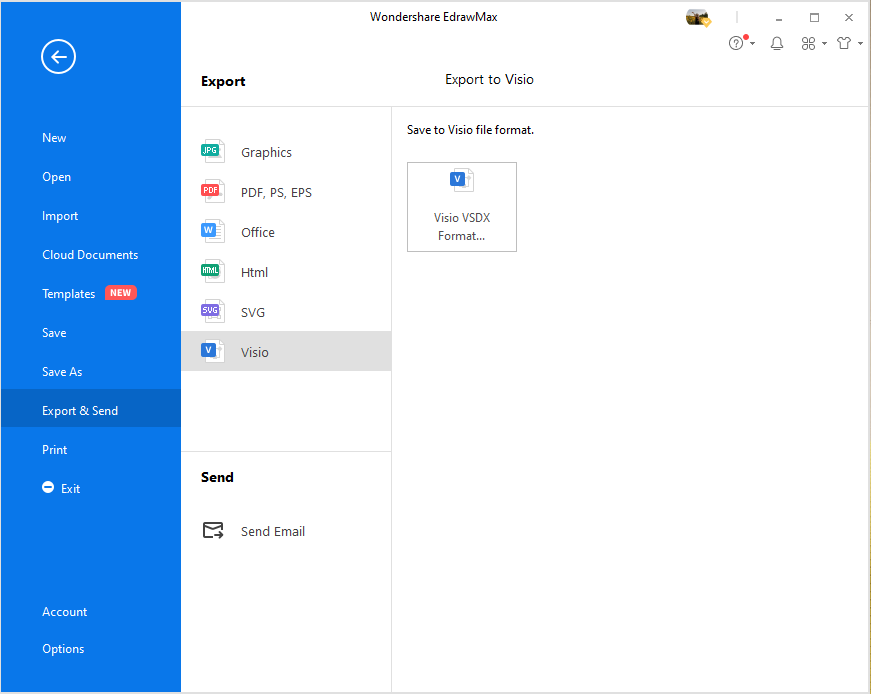
Step 4: After you've finished your design inside EdrawMax, share it with the world! EdrawMax supports exporting the diagram in many file formats, including Visio, PDF, JPG, PNG, Word, Excel and PowerPoint.
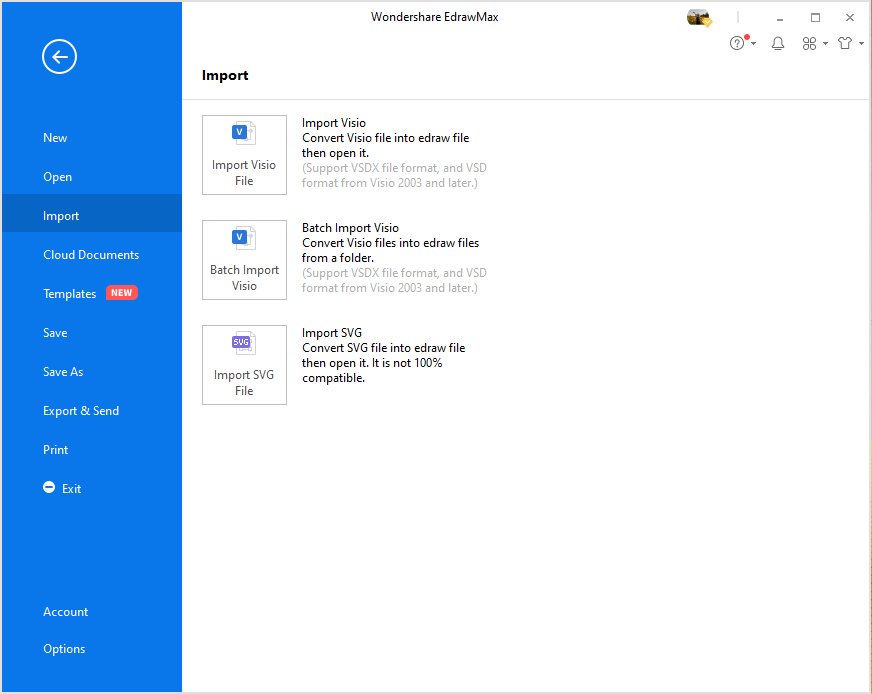
Besides, EdrawMax also allows users to import the Visio files and convert your Visio architecture diagrams in seconds.
Why EdrawMax to Draw Your Diagrams?
Always motivate yourself and your team to use the industry recommended EdrawMax software when it comes to designing an architecture for managing the data. EdrawMax is the free software that is specifically developed for diagram-making and chart-making.
According to the developers, EdrawMax has hundreds of pre-generated templates relevant to every field of diagram that is made to ease your work and make you do everything from nothing. The software has more than five thousand industrial standard diagram-making symbols that will suffice to complete your diagram by placing them in order by the drag-and-drop facility.
EdrawMax is so efficient that it can run on your web-browser, or any operating system like Linux, Mac, Windows. The software also has the best pricing options for enterprise use that require more advanced features.
