How to Create a Dashboard
Part 1: What is Dashboard?
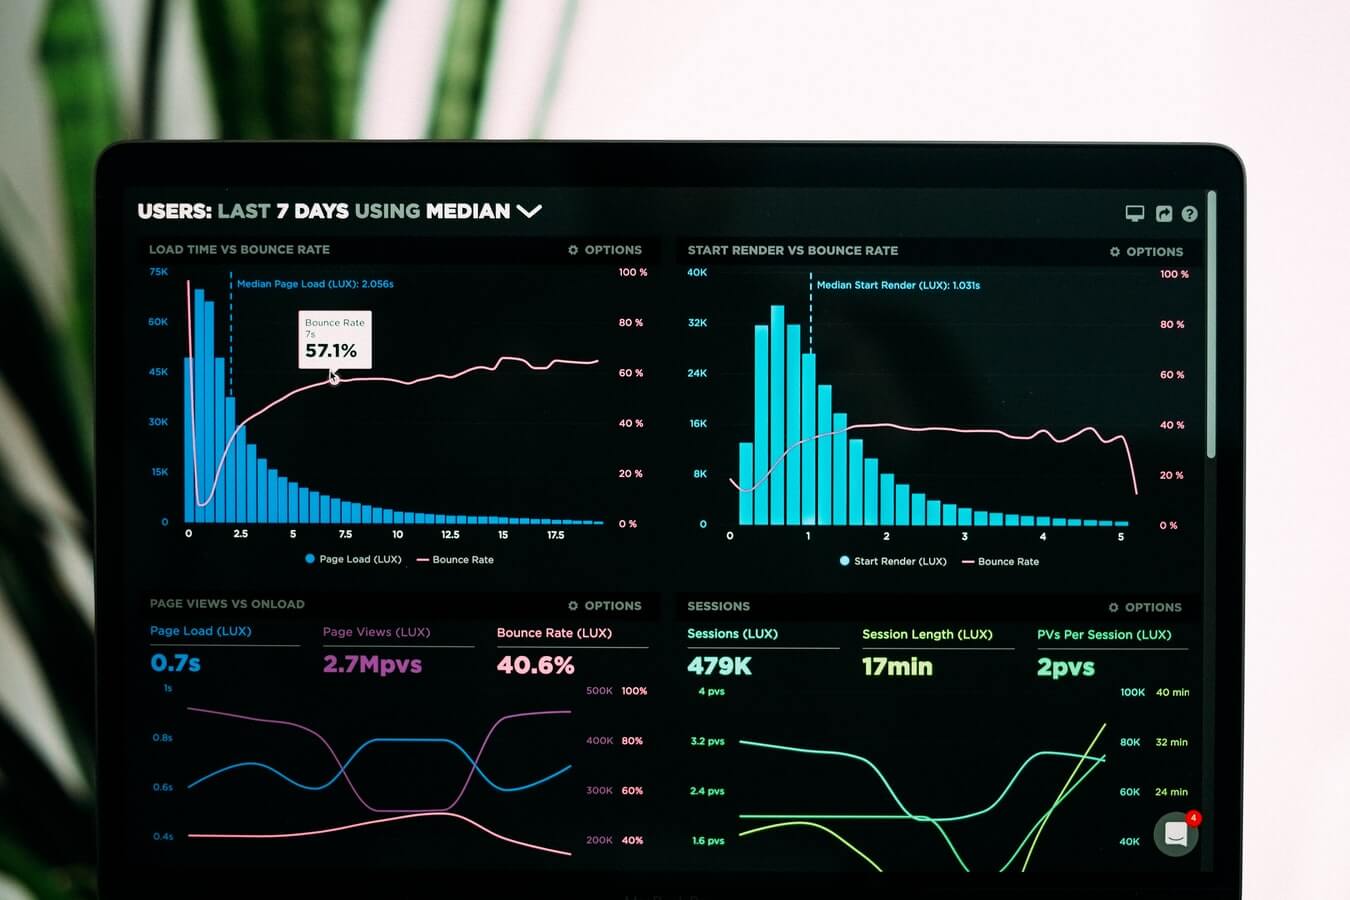
Dashboards are used to display a variety of charts and data relating to key performance indicators (KPIs) in business. They can be used to document and analyse the metrics of certain departments or individuals in a business. Typically, a dashboard will include a line chart, pie chart, bar chart, and gauges, among other possible charts.
A dashboard will often provide business users with real-time updates about an individual or department's progress, making it easier than ever to monitor their performance. It allows the company as a whole to ensure that KPIs are being met, and any anomalies can be quickly identified and dealt with. These are especially useful in the fields of marketing and sales.
Part 2: How to Make a Dashboard Effortlessly?
How to make a dashboard easily? Using EdrawMax to create your own dashboard.
Step 1: Open EdrawMax desktop software or EdrawMax web-based application.
Step 2: Navigate to [New]>[Marketing]>[Sales]
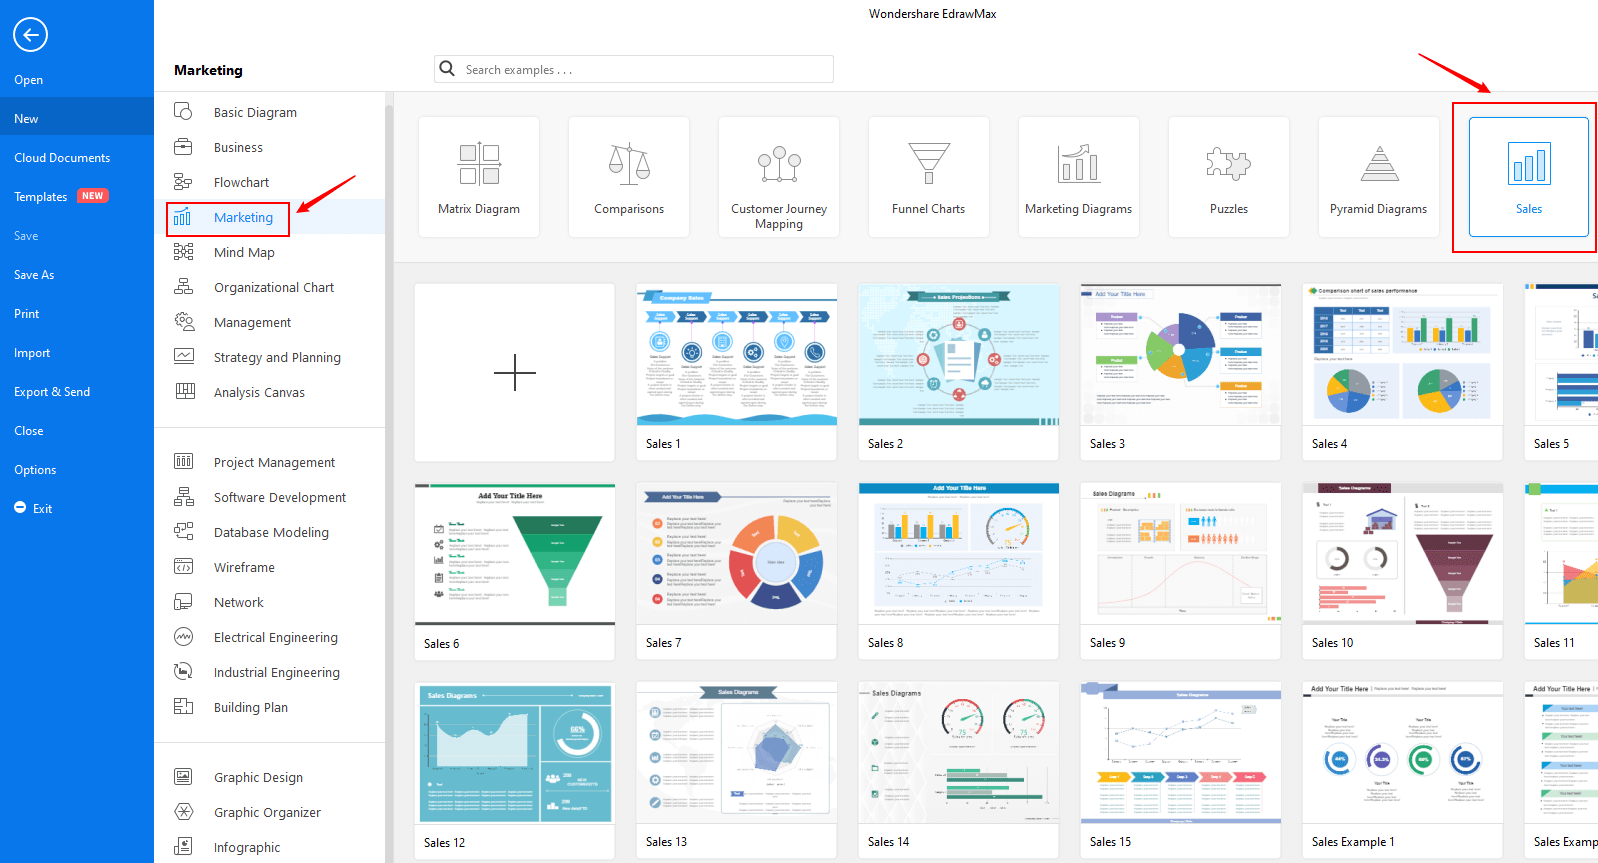
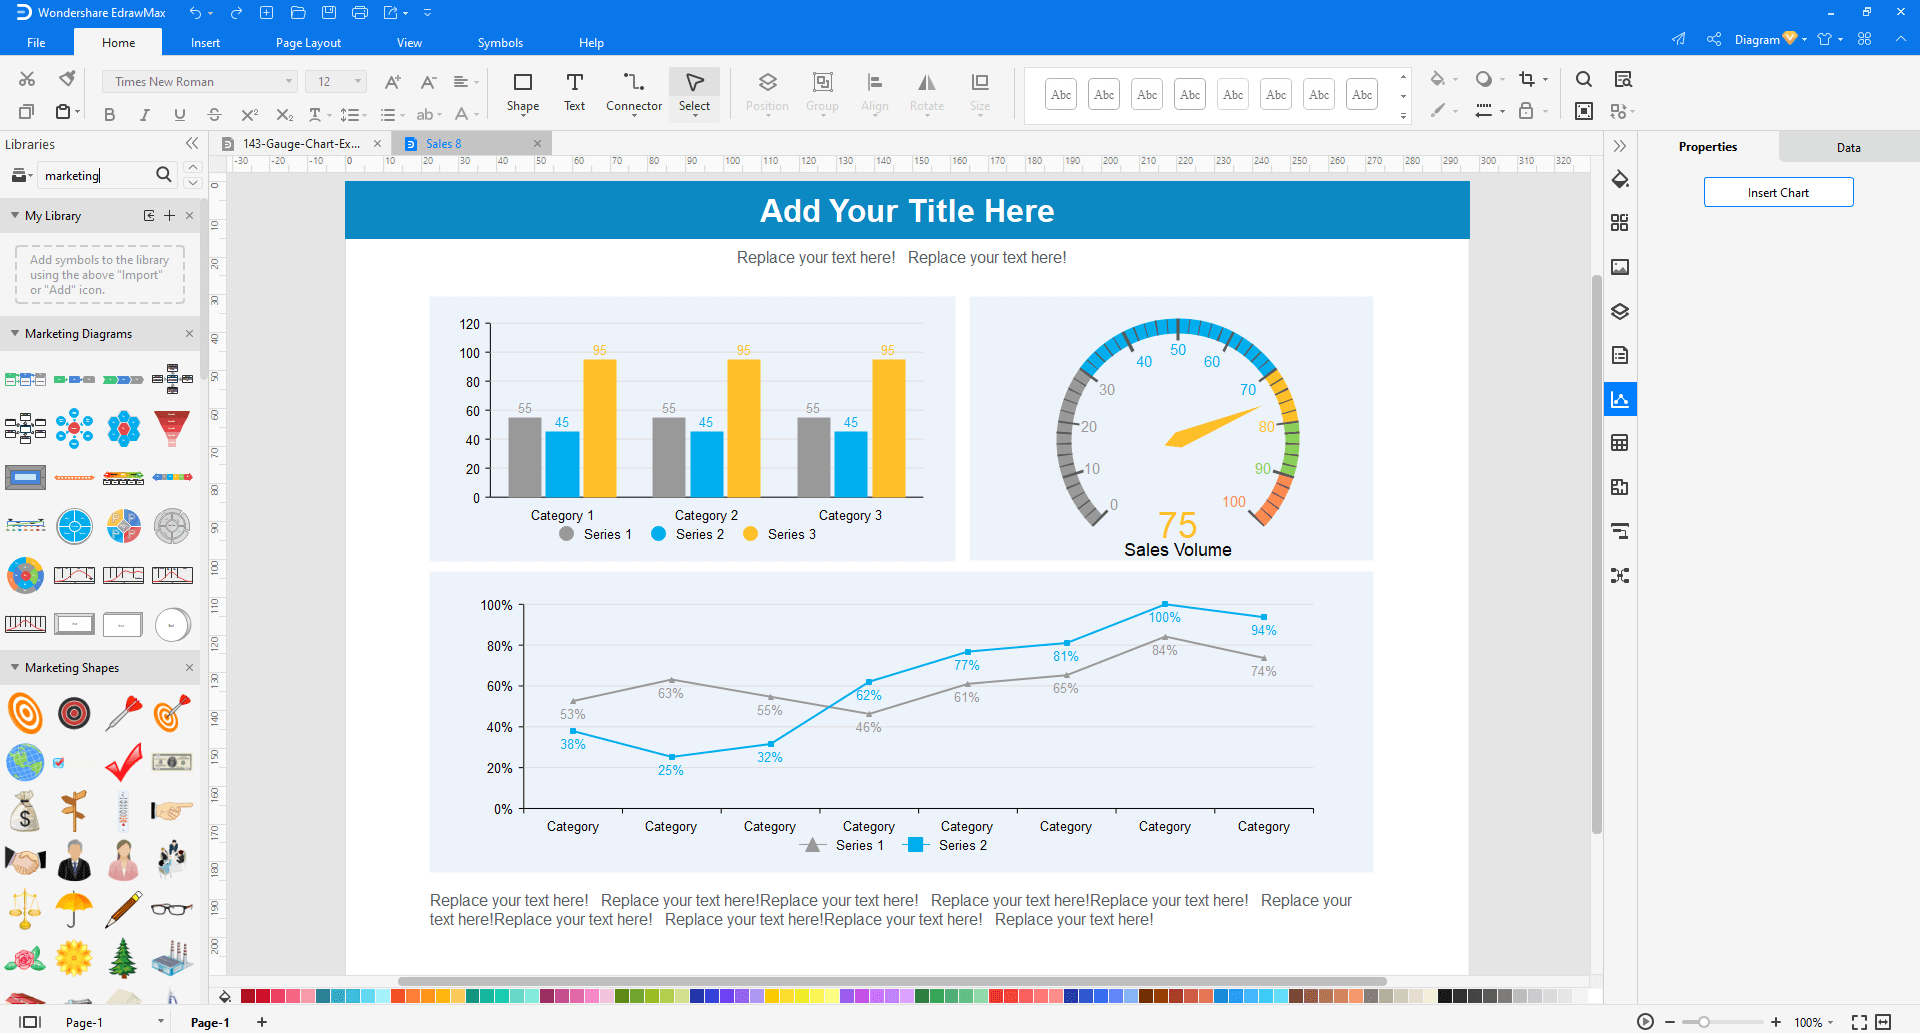
Step 3: Select one dashboard template to edit on it or click the [+] sign to start from scratch. Also, you can use massive dashboard symbols and elements from libraries in left menu to customize your diagram.
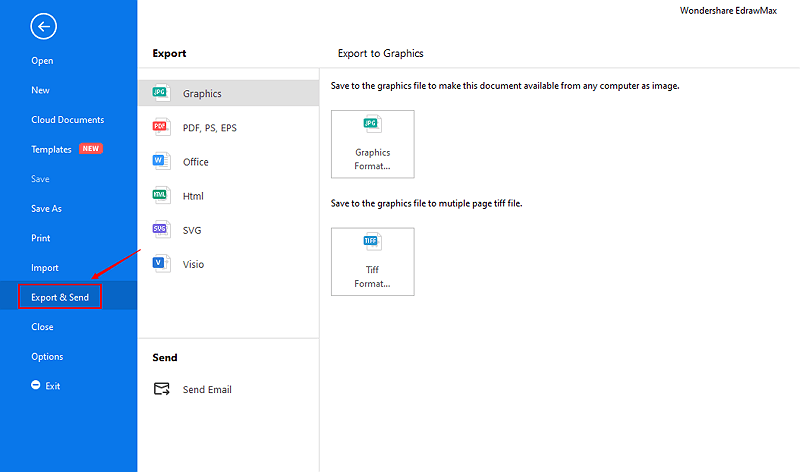
Step 4: Once finished your creation, you can export the file in multiple formats, including Graphics, PDF, editable MS Office file, SVG and Visio vsdx file.
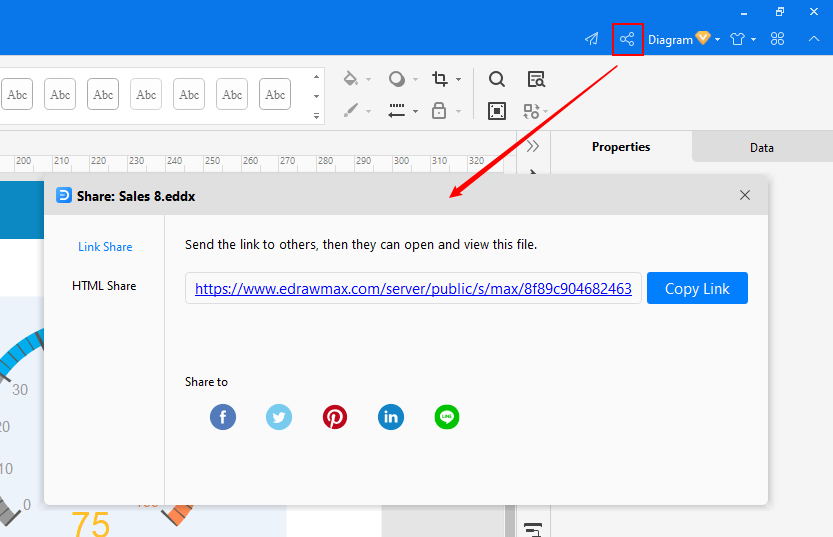
Step 5: Besides, you can share your diagram with others via social media and web page. Or publish your diagram in EdrawMax template gallery to show your work with others.
Part 3: Dashboard Examples
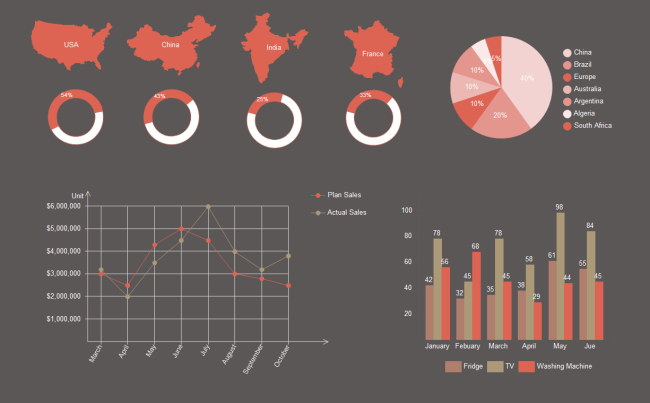
Example 1: Marketing Dashboard
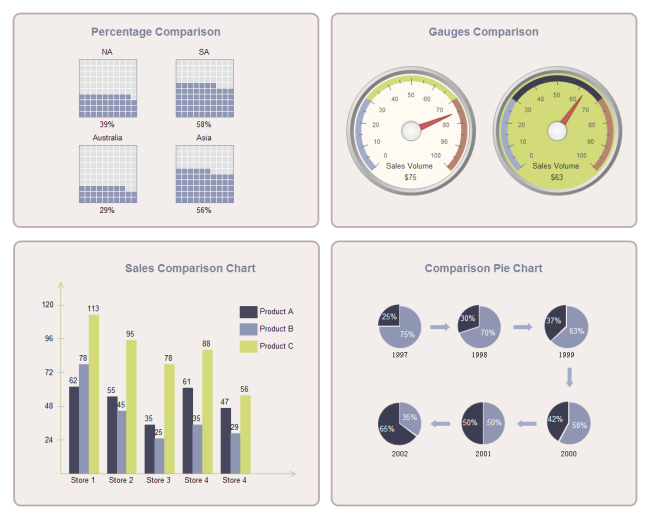
Example 2: Comparison Dashboard
Part 4: Conclusion
According to this article, there are mainly three parts to illustrate what is dashboard, to tell you how to create dashboards and to show you some dashboard examples. Generally speaking, a dashboard is a type of diagram which often provides at-a-glance views of KPIs related to a particular objective.
EdrawMax is an easiest all-in-one diagramming tool, you can create dashboards and any other type diagrams with ease! With substantial dashboard symbols and cliparts, making dashboards could be as simple as possible. Also, it supports to export your work in multiple formats and share your work with others. Get started to create your dashboards now!

