Network Diagram Examples & Templates
Edraw Content Team
Do You Want to Make Your Network Diagram?
EdrawMax specializes in diagramming and visualizing. This article explains everything about network diagram examples and templates and how to use them. Try it free now!
Any network related to this digital world can be represented through a virtual or physical image. That virtual or physical image is known as a network diagram. All network components can be shown in these diagrams depending on their type, size, and purpose. Components like routers, devices, sources, computers, receivers, firewalls, hubs, and databases unite to make a successful network. A network diagram can show complex network arrangements through mapping and graphing, making it easier to understand people. A network image consists of many details, points, and joints. Any company, agency, or organization can't stand without such networking figures. Networks are broadly divided into Physical Networks and Logical Networks.
You can review several network diagram examples showing how a good network arrangement can build a successful company. If you have a loose or weak network system, you will face issues in daily life. In this article, you will see different benefits of network diagrams, making you understand the importance of a good network. Further, in this article, you will learn to create a well-labeled network diagram using the EdrawMax application. There are various customization and management tools to create a perfect network image. Some examples regarding different network types will help you decide on the best network for your needs.
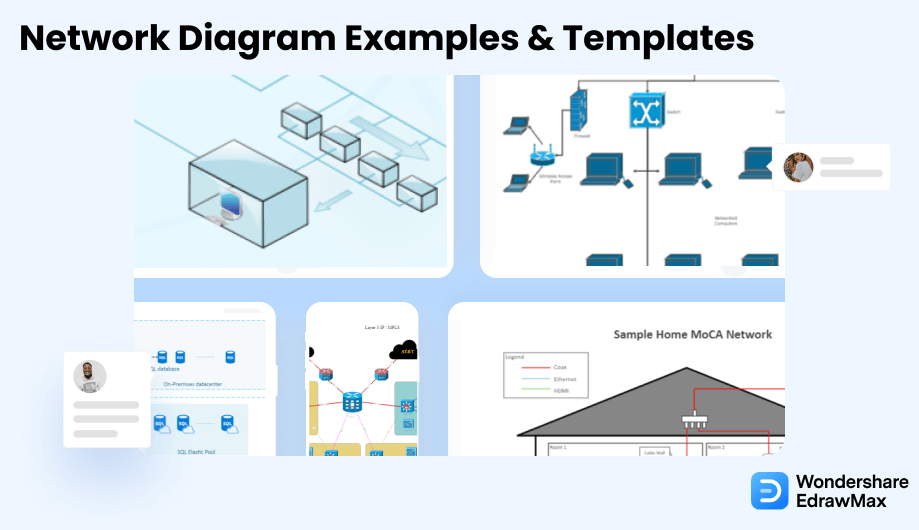
1. Free Network Diagram Examples
A network diagram visualizes a vast network that shows how each activity is linked through different meeting points. It also tells the types of networks being used, the time consumed by an activity, and the involvement of various tasks in a packed system.
Different Network diagrams involve specific symbols, graphs, lines, and mappings. An icon represents a device being used in that network diagram. Some represent the actual devices, whereas some represent the connection between them. These examples help allocate various resources so anyone can analyze a specific data or project's status, progress, evaluation, and depletion. An example showing a visual network must have clear markings, identifiable components, completion points, different interrelationships, and an estimated time calculator to guide others best.
- 1. Network Topology Diagram
- 2. Logical Network Diagram
- 3. Physical Network Diagram
- 4. Rack Diagram
- 5. LAN Diagram
- 6. WAN Diagram
- 7. MAN Network Diagram
- 8. Cisco Network Diagram
- 9. AWS Network Diagram
- 10. Azure Network Diagram
- 11. GCP Network Diagram
- 12. Computer Network Diagram
- 13. Firewall Diagram
- 14. DMZ Network Diagram
- 15. Network Switch Diagram
Example 1: Network Topology Diagram
A network comprises nodes and several connecting lines between a sender and a distant receiver. This arrangement is known as Network Topology. Network topology is nothing but how the network components are arranged. The network topology can be illuminated both physically and logically. With different types of network topologies, the data flow between the network devices also varies. It causes many pros and cons within different network topologies. The physical topology shows us how the network hardware components are arranged, while the logical topology depicts how the data flows between the devices in the network.

Example 2: Logical Network Diagram
Logical networks represent the flow of information in a particular network. The Logical network components shown in the above example are subnets like IP addresses, masks, VLAN IDs, routers, firewalls, internet protocols, routing domains, traffic flow, segments, and voice gateways, among many other network objects. Logical networks are known for being easy to manage by sharing information, capacity planning, eliminating redundant activities, and identifying troubleshooting problems.

Example 3: Physical Network Diagram
Physical Network is the second type of Network topology. It reflects the actual image of a network topology, showing all its components and connections within them. It shows all the physical features, such as cables, servers, ports, racks, and hubs. You can imagine a physical network as a server diagram, cabling diagram, combination of diagrams, or rack diagram. It is responsible for reflecting all physical components of an entire topology. These components include connections, labels, diagram legends, and switch stacks.

Example 4: Rack Diagram
The rack diagram is also illustrated in the form of rack elevation. It virtually represents various IT equipment of an organization inside a specific server rack. It is usually used to monitor and manage different assets of a data center. Server Racks are placed to ensure security within a system. You can easily find them in central data hubs or even small computers. One should plan appropriately before installing these server racks, as they can create problems like insufficient space.

Example 5: LAN Diagram
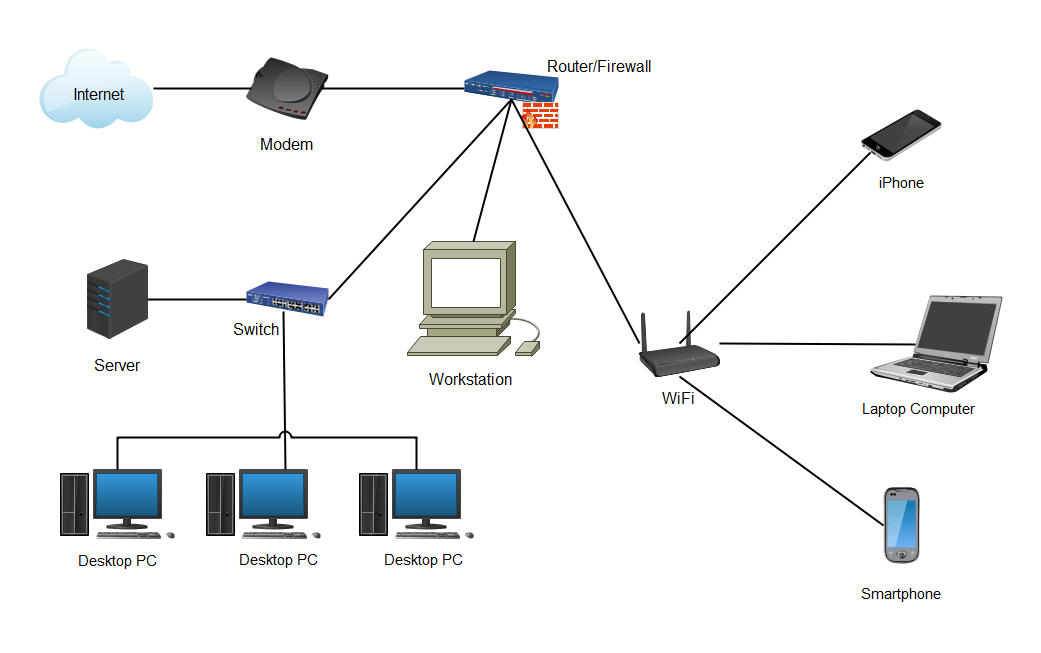
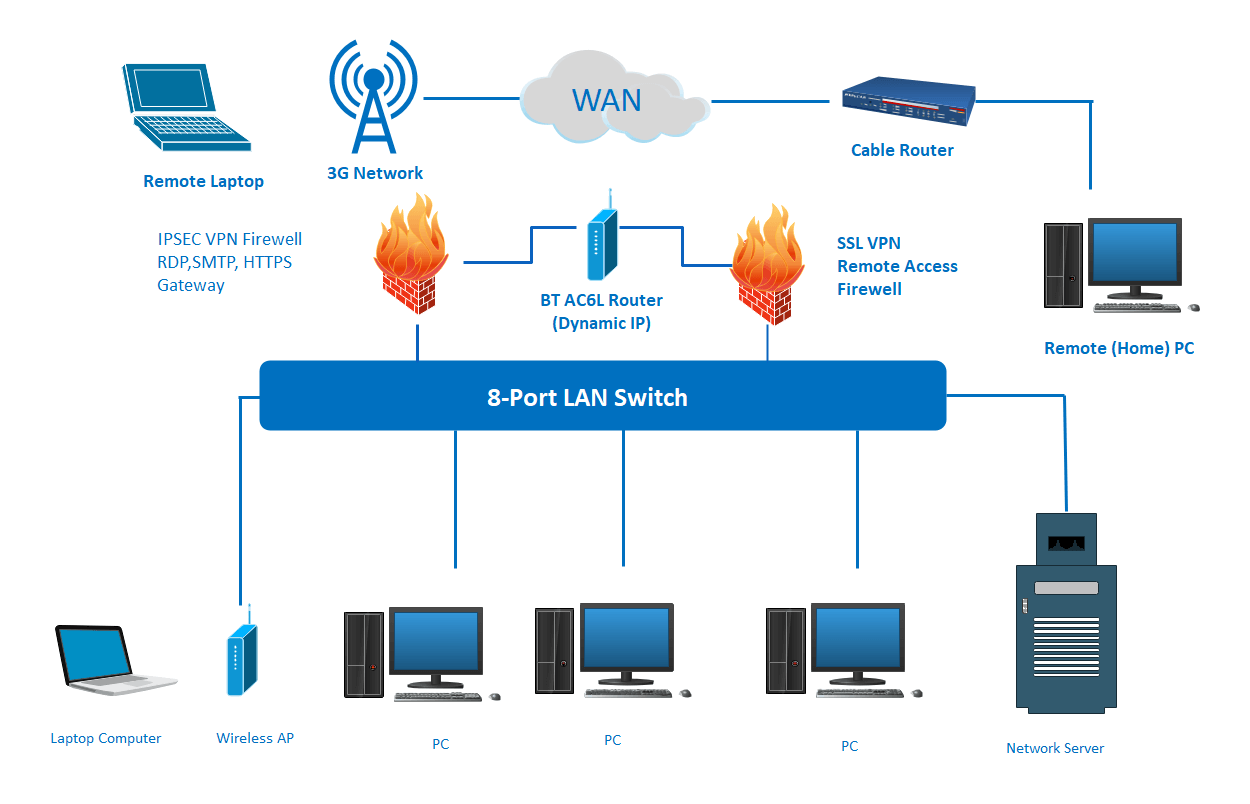
LAN is a Local Area Network that connects local regions or places like schools, houses, offices, laboratories, and private buildings. It is a device linked with a domain server of a particular locality. This helps share a specific printer or a disk with hundreds of customers. It comprises several wires and connecting cables linked on the base of a previous network diagram. It reflects the communication schemes, physical structure, and network arrangements in local areas. They are used mainly by IT professionals to monitor networking in a particular area.
Example 6: WAN Diagram
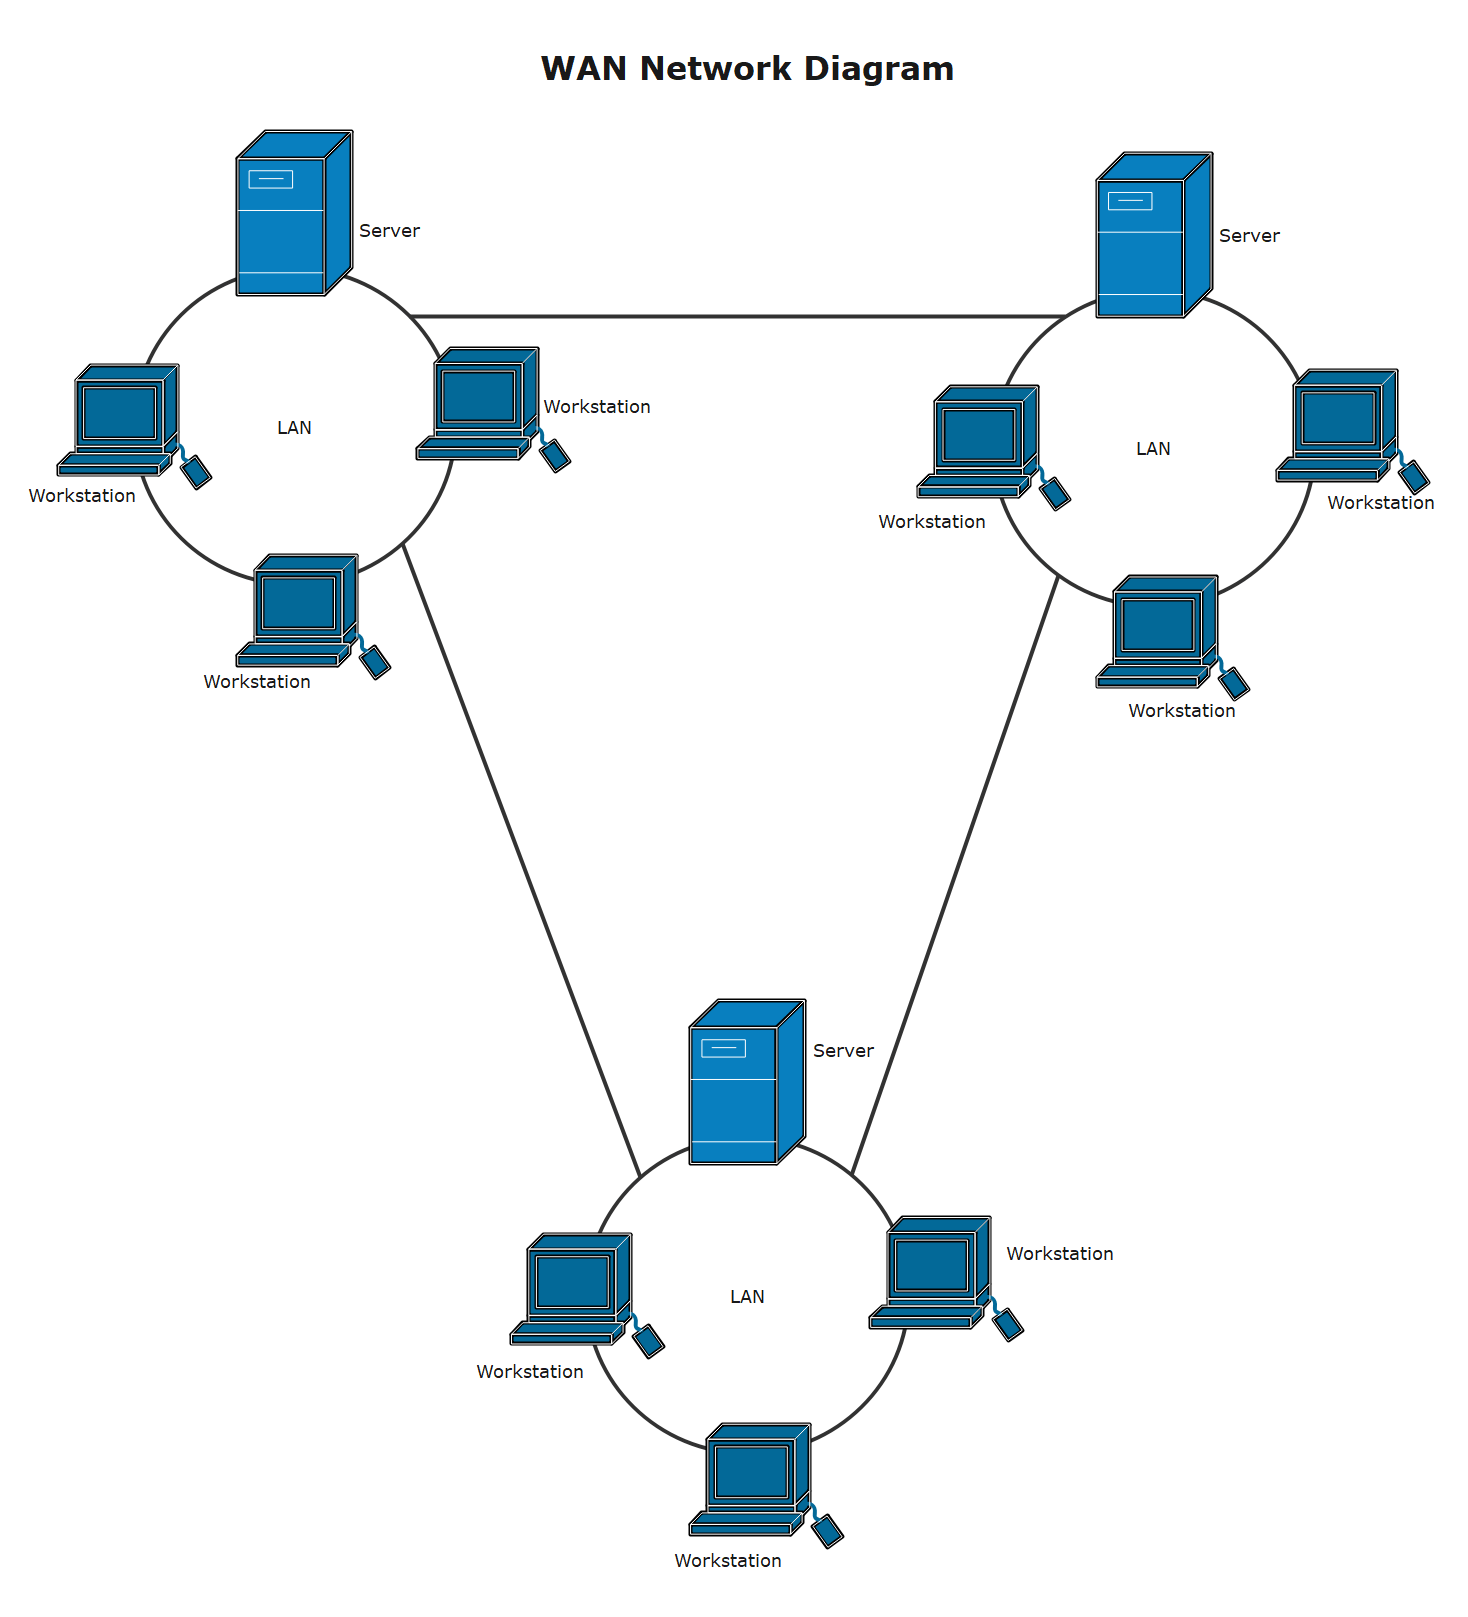
WAN is known as Wide Area Network, a collection of local area networks. It is distributed geographically and connected to the leading network using several services offered by local carriers. WAN networks are primarily used in enterprising environments with offices in various states, countries, and cities. In old times, WAN was a limited network within T1 lines, switching services, modems, and other low-bandwidth devices. They primarily connect with ISDN, but other options are now available. Now, WAN can be used by low- and high-bandwidth services and connected through VPNs.
Example 7: MAN Network Diagram
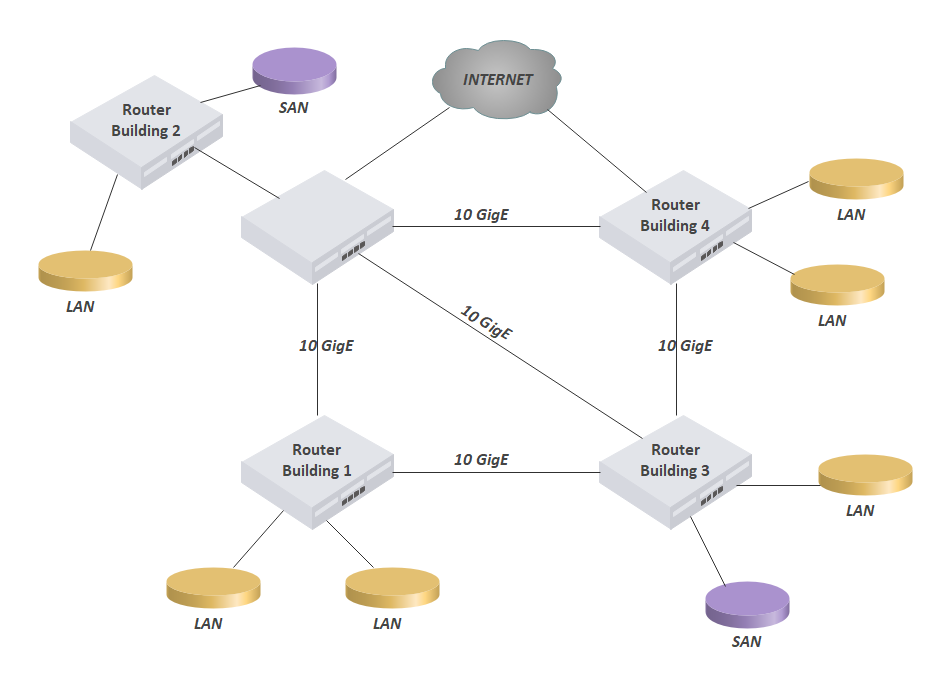
MAN is known as Metropolitan Area Networks, which is more significant than local area networks but smaller than wide area networks. It is mainly used to connect networks in a specific city. MAN Network has a size range starting from 5 km to an end range of 50 km. You can compare it to the size of buildings located on a particular campus or a complete city. Data rates are usually found to be higher than moderate rates. Different user groups and network providers generally own MAN networks. They offer services to every user in their range and share local resources within them. They work as an uplink to connect the internet, LANs, and WANs.
Example 8: Cisco Network Diagram
Cisco Network is the world's famous networking leader in the computing sector. It helps to transform connections and collaborations between people from different-sized companies. This network manufactures various networking equipment, from routers, bridge switches, frames, and servers to software management. It is considered the most intelligent architecture of different network types, and higher organizations use it for secure connections. Cloud, WAN, and LAN, all three networks use Cisco as their networking system based on the internet. Cisco routers have advanced analytics, optimized applications, and integrated security for providing secure and verified solutions.
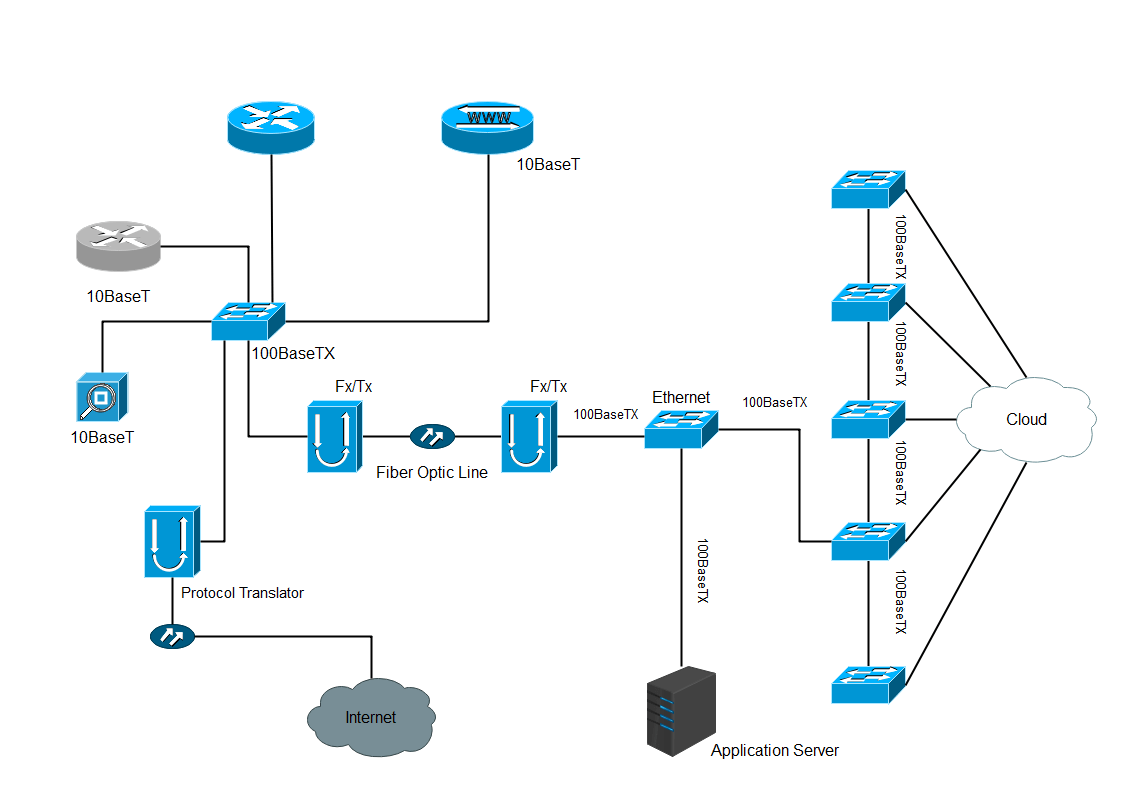
Example 9: AWS Network Diagram
The example is one of the best AWS network diagrams regarding cloud platforms. It reflects the architecture diagram of a cloud computing platform offered by Amazon. This diagram contains various segments, lines, specialized icons, symbols, containers, and connections. Amazon Web Services (AWS) diagram illustrates the basic networking design adopted by Amazon. It can be used to plan projects, design architectures, and audit blueprints. If you like, you can also use this diagram to connect and conspire with other teammates. Creating these diagrams is relatively easy by following simple steps and considering essential points. EdrawMax is a perfect application for creating such designs and applications.

Example 10: Azure Network Diagram
The Azure diagram is another cloud computing architecture diagram led by Microsoft. It helps in designing various applications and solutions in the Microsoft cloud. We know that Azure is based on a cloud network that analyzes, stores, computes, and represents virtual graphics and infrastructure. Azure Network topology allows you to visualize all resources involved in a network virtually. Azure Portals, power shells, and Azure CLIs are different options for visualizing a topology. It's a mapping that shows how the infrastructure is arranged and managed compared to an architectural size.

Example 11: GCP Network Diagram
Google's visual representation of a cloud networking platform is called the GCP Network Diagram. Google Cloud Platform is a vast network, and therefore, it needs a clear diagram to be captured by others. GCP network diagram works like an infrastructure design and offers each essential aspect of the program. GCP network diagram users get access to a vast network and execute that in their respective projects and databases. Usually, people find it hard to understand such cloud platforms because they don't know how it works. So, Google Cloud Platform is the simplest and easiest networking platform to work with clear connections through its networking diagram.

Example 12: Computer Network Diagram
A system that combines various independent computers into the leading network that shares information, resources, and services is known as the Computer Network Diagram. This works as an integrated network within different computers to ease the communication between various users. Different computers unite and get linked together to form a successful computer networking system. This system can be wireless or cable, depending on the users' needs. Servers, hardware, software, browsers, PCs, and other hosts are reflected as nodes in this system's example. Different hosts and IP addresses are used to locate a device in a computer network.
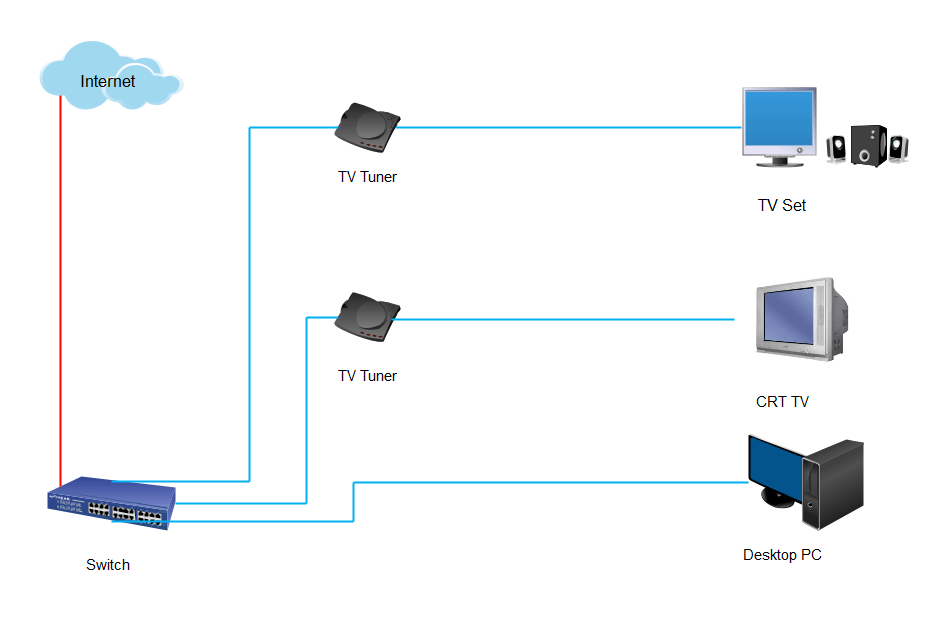
Example 13: Firewall Diagram
A firewall acts as a barrier between LAN and unprotected internet. It keeps the internal storage aside from incoming data and packages. It keeps each database confidential to the authorizer and eliminates the risk of hacking and tampering. We can say it is responsible for controlling network traffic from both directions. The above example represents a firewall distinguishing between local networks and unrecognized internet. The point where both are connected is known as the vulnerability joint. You can use hardware and software to filter unsafe content for this joint.
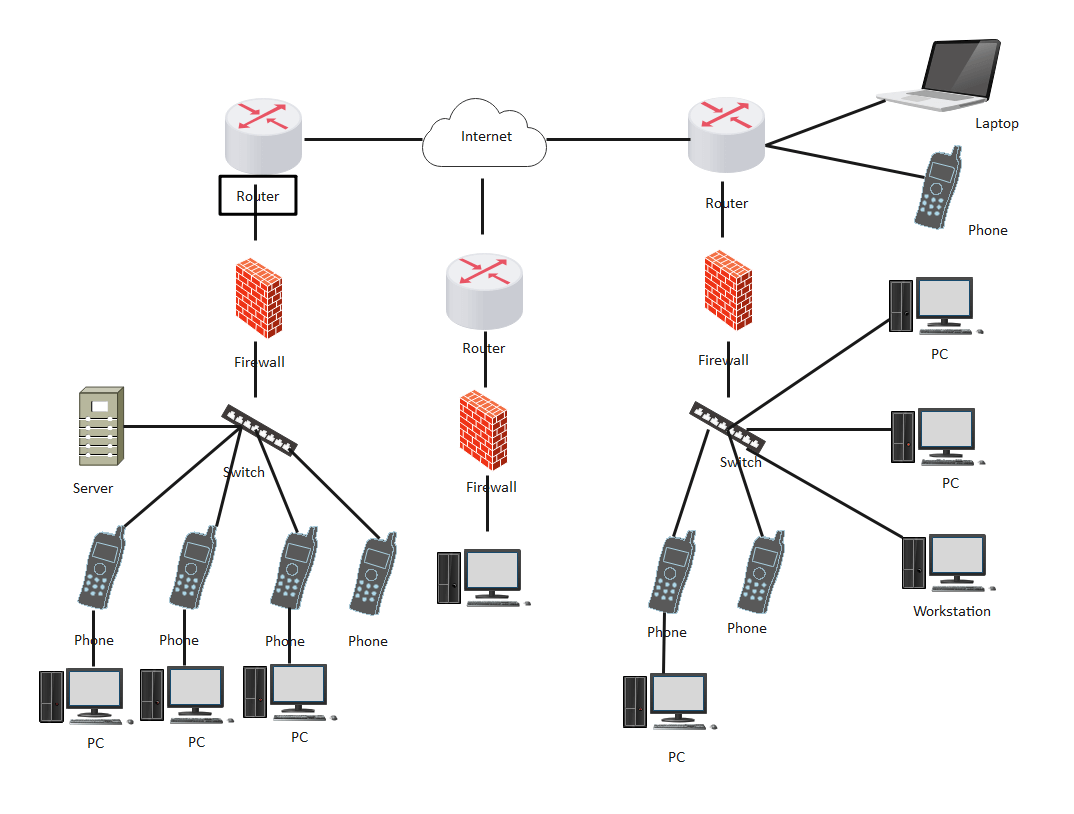
Example 14: DMZ Network Diagram
DMZ is known as a Demilitarized zone, which is used to secure and attach one more layer to the security zone of LAN from unverified sources. A usual DMZ works as a connection between private and public networks. DMZ filters the untrusted traffic from unknown sources and allows it to enter the system when found safe. It restricts all data found to be unsafe for the system's security. DMZ stores resources, external services, DNS (Domain Name System), mail, VoIP, FTP (File Transfer Protocols), proxies, and web servers. It limits access to any local area networking system to ensure the safety of the internal data. DMZ is a rivalry with hackers, making the files and systems harder to hack and tamper with.
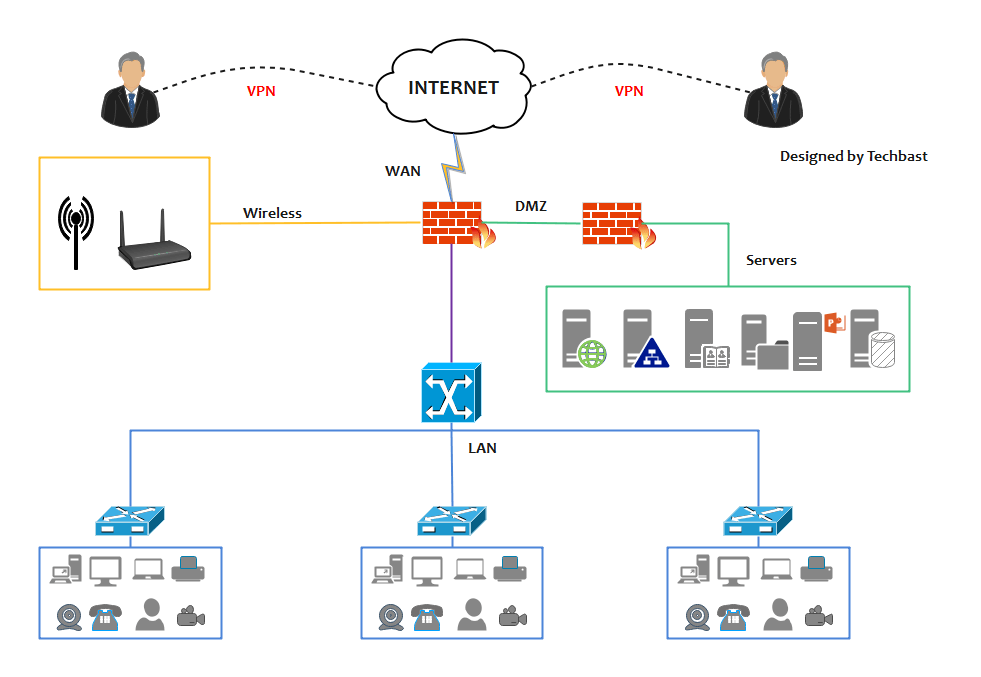
Example 15: Network Switch Diagram
The above example is a virtual representation of a network switch, also known as a bridging or switching hub. It uses packet switching to connect devices in a computer network system. It acts as a multiport that works on MAC addresses to forward the data to the second layer of the OSI blueprint. Switches that transfer data to the third layer by routing services are known as layer-3 switches.
2. How to Use Network Diagram Examples
EdrawMax is vector-based software that provides various templates for your network diagram. It provides an easily understandable interface for its users to draw efficiently and helps users edit existing templates and layouts and make their designs or templates. It also includes network diagram symbols to illustrate your network diagram. There are two methods for creating a network diagram by using Network diagram examples:
2.1 Make Network Diagram from Desktop
Step1 Install EdrawMax
You can edit the templates directly from this page. First of all, when your mouse clicks on the templates on this page, you can download EdrawMax easily, or you can download EdrawMax here.
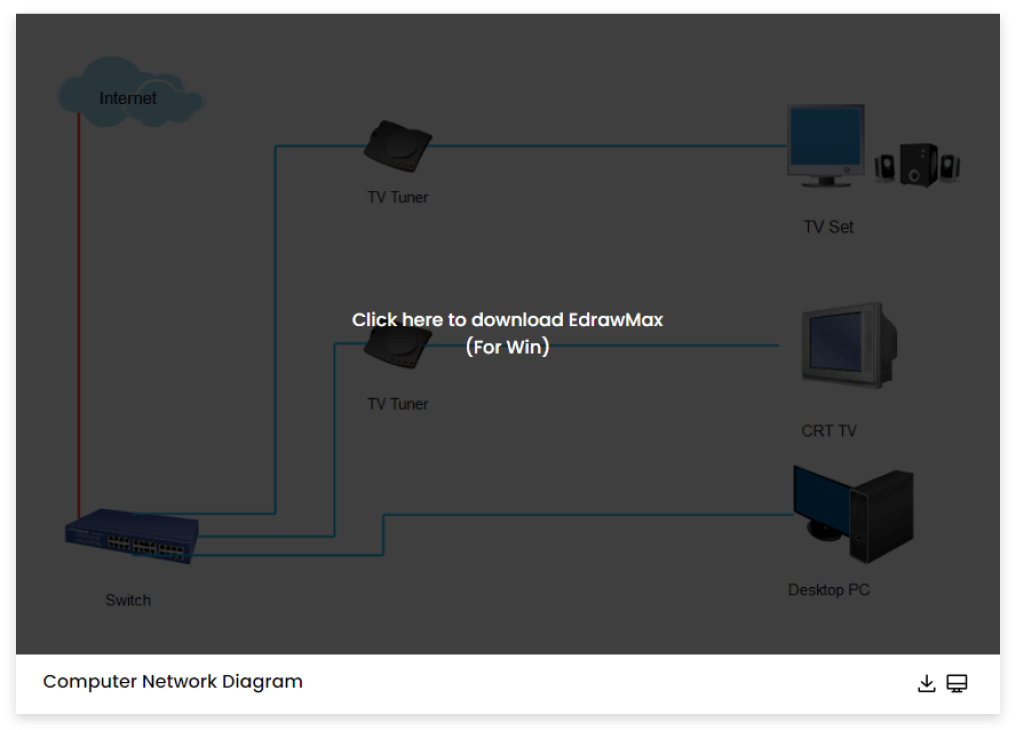
Step2 Download the Template
After installing EdrawMax, you can download the template by clicking on the bottom right corner or looking for a template in the EdrawMax library without going online on the desktop.
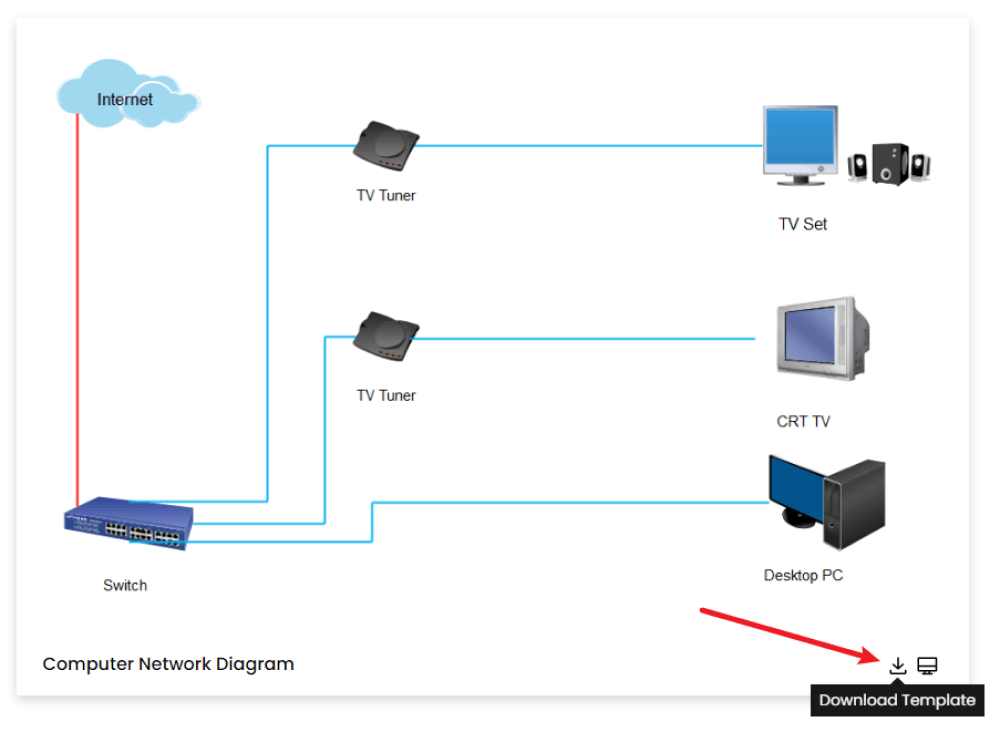
Step3 Open the Template
After downloading the template, you can double-click to open it in EdrawMax diagramming software, or you can open EdrawMax beforehand and navigate to the template to open it.
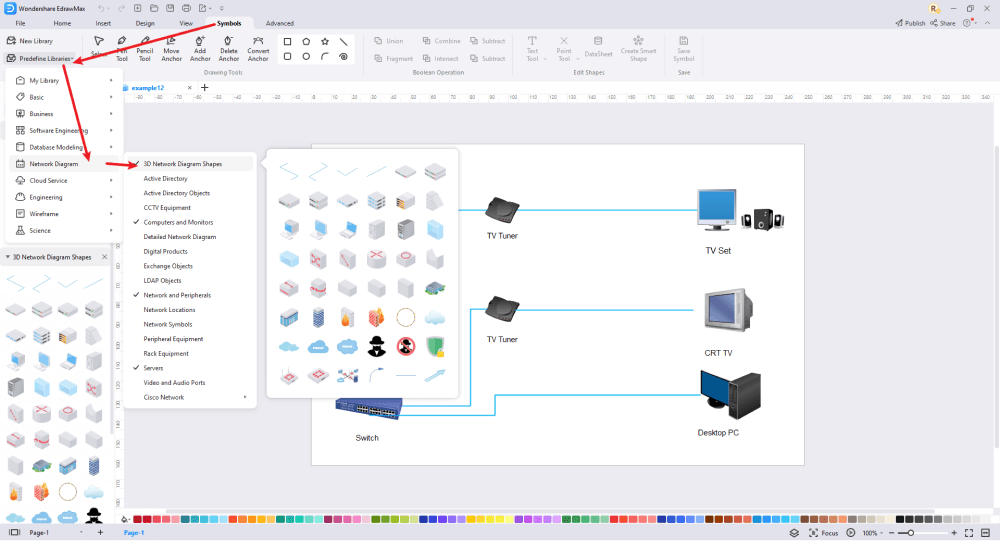
Step4 Customize the Network Diagram Example
After opening it, the next step is to customize and edit the network diagram example. EdrawMax gives you various unique diagramming tools that help you edit the template any way you want. You can change the template's color and font liner. EdrawMax features a comprehensive library with 26000+ professional symbols that you can use for free with an easy drag-and-drop.
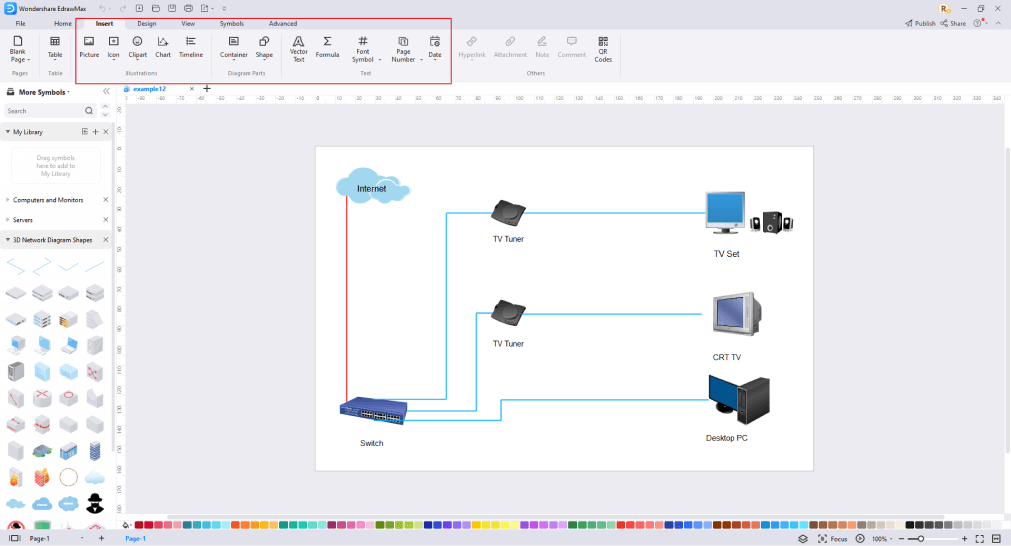
Step5 Save or Export
After you customize the network diagram example, the next step is to save or export your drawing. EdrawMax supports various document formats, so you can export your drawing in any format you want, such as Microsoft Office, PDF, graphics, HTML, Visio, and many others. Export your drawing by going to the 'File' option in the top menu bar and clicking on 'Export.' After that, select the document format and click 'ok.' You can also share your drawing on social media or print it directly from EdrawMax. EdrawMax also gives you a presentation mode that you can use to show your drawing to others or your team members.

2.2 Make Network Diagrams Online
The above process was for the downloaded application. Here are the steps you can follow to do the same thing with the online app. EdrawMax Online gives you free templates to select, customize, and share without downloading. It also provides you with all the drawing tools in the EdrawMax software.
Step1 Click to Duplicate Online
Just click the bottom right corner to choose 'duplicate' template online, and then you can go to the online EdrawMax template community. You can head to the network diagram page and learn more or use it directly.
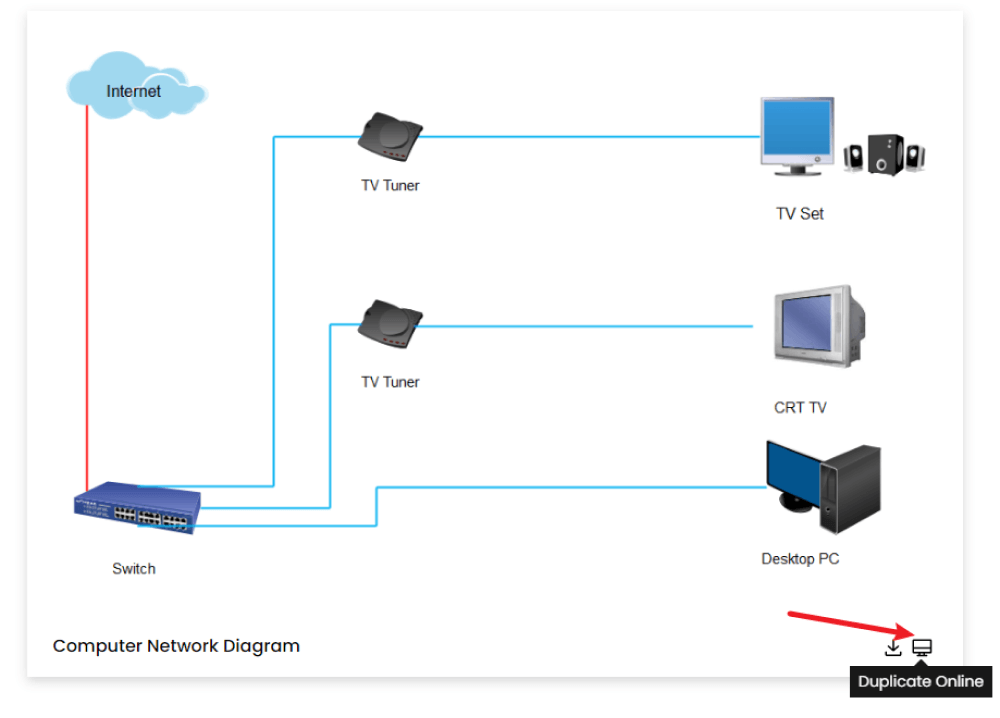
Step2 Search for More Templates
To find more templates, go to the EdrawMax template community and search for the template you want. You can scroll down or search with the full name of the network diagram template to find it quickly.
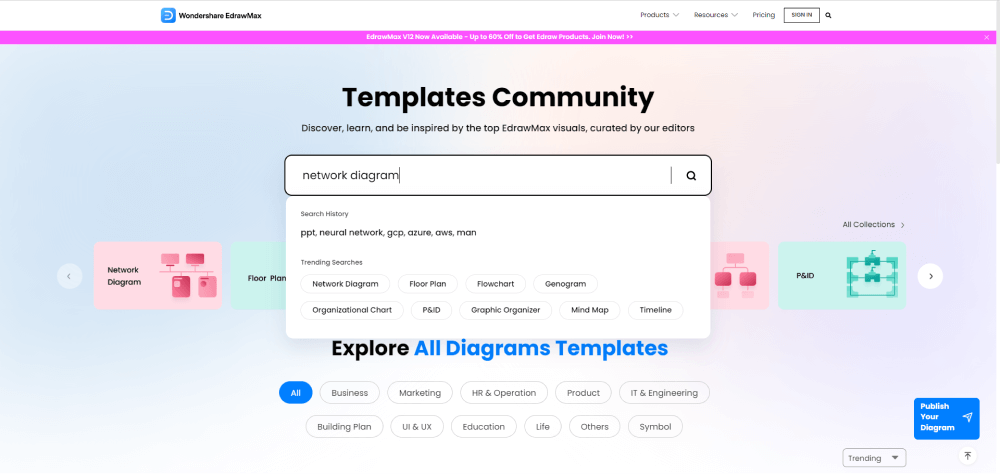
Step3 Open the Template
Open the template you want to customize and click the 'duplicate' option. After clicking, the template will open with EdrawMax Online.
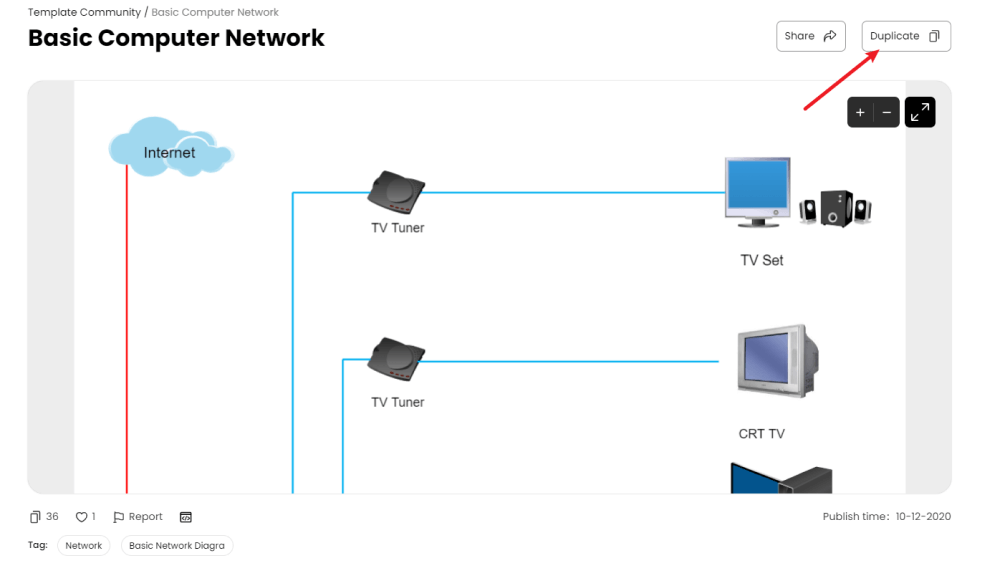
Step 4 Customize the template.
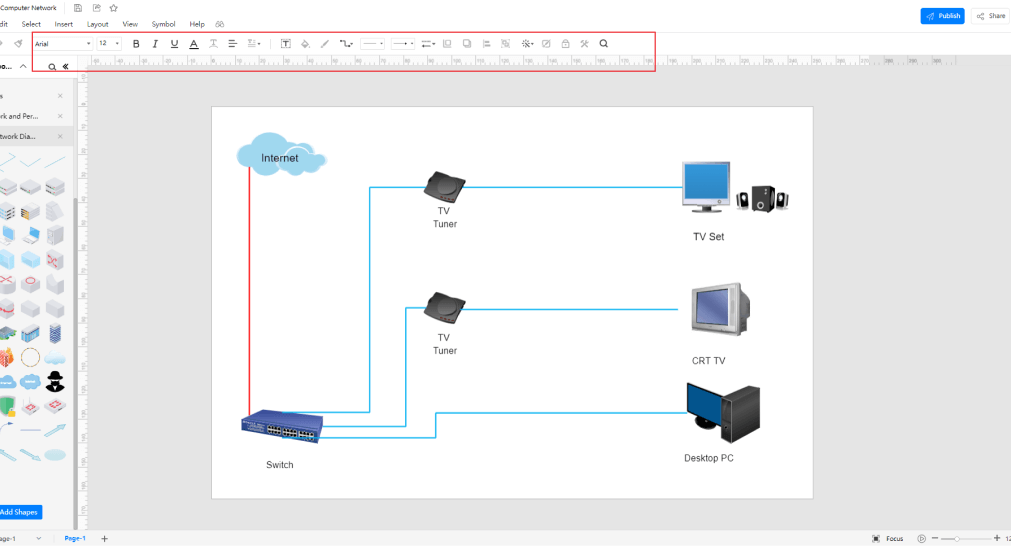
Customize and edit the network diagram example after clicking the duplicate option and getting the drawing canvas with your selected template. EdrawMax features unique diagramming tools that help you customize the template and make whatever changes you want. You can change the color and the font liner of the template. EdrawMax also features a comprehensive library with 26000+ professional symbols that you can use for free with an easy drag and drop.
Step5 Save or export
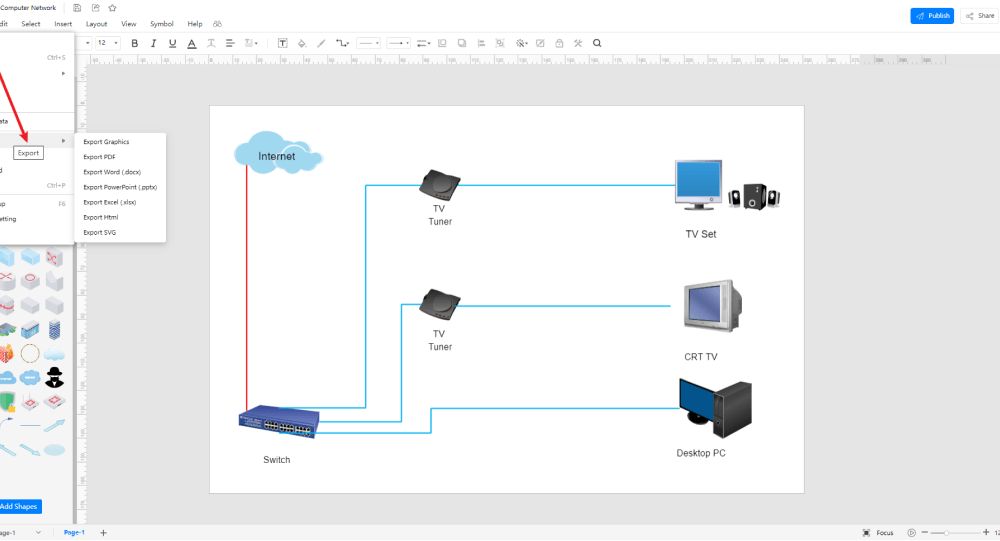
After completing your network diagram, the next step is to save or export your drawing. EdrawMax gives you the same features as the EdrawMax diagramming software. It also supports multiple document formats to export your drawing in any format. You can save and share your document in PDF, graphics, HTML, Visio, Microsoft Excel, and other popular formats. Click on the 'file' menu and go to 'export'. Click the format you want and enter. EdrawMax features a presentation mode and allows you to share your drawing on social media. You can also "Publish" your network diagram in the template community.
3. Free Network Diagram Software
If you are designing art, then it must catch the attention of viewers and fascinate them. A Network Diagram Software allows you to design a perfect visual representation of various networks, which different employers and developers use to guide new employees. Other than all software, EdrawMax stands unique by allowing you to sketch a diagram with different lines, textures, graphics, fonts, colors, highlighters, and images. Here are some key features of the EdrawMax application that will make you believe in it completely:
- Charting and collaborating tools
- Wide variety of network diagrams
- Easy visualization of designs and graphics
- Easy exchange of files among users
- Modern features and regular updates
- Safe and protected environment to work
4. Final Thoughts
Network diagram examples are significant in this digital world. Any company, organization, or agency can't be operated without such network diagrams. It makes a complex Network diagram easy to understand and capture. Beginners can also create these types of designs, posters, flyers, mappings, or networks by accessing the EdrawMax beginner account. EdrawMax also offers a premium account to get all the updated features on time.
EdrawMax is the best network diagram software. It offers hundreds of free templates and creative drawing tools that help you customize templates and create a diagram in minutes. EdrawMax supports multiple document formats and is the first choice of professionals for its fast drawing, data automation, and symbol import features.

Network Diagram Complete Guide
Please look at this complete guide to learn everything about network diagrams, including types, symbols, and how to make a network diagram.
You May Also Like
Elevation Plan Examples & Templates
Examples
Closet Design Examples & Templates
Examples
Building Plan Examples & Templates
Examples
Floor Plan Examples & Templates
Examples

