Science Infographic
Edraw Content Team
Before giving a lecture on science or its topics, you must stop and think that would the traditional methods be an easy way for students to understand the complex subject of science? See the past patterns and students' scores. You will realize that the legacy teaching methods always fail to make the student's concepts clear about the science.
Rather than teaching them with words, you can teach them with visuals. It is human nature that they easily understand the pictures or graphics. The visual input easily gets processed in the human mind making them know quickly.
Here, we would like to introduce the concept of infographic teaching. The topic is nothing but a method through which an instructor can give lectures in the form of infographics. In this article, you will get the concept of science infographics, how to make them, and some templates related to them.
Why Use Science Infographics?
Before understanding the science infographics, we should get a little familiar with infographics are. An infographic is a graphical, pictorial, and colorful representation of any data, knowledge, or information.

Infographics are the best way to understand any topic, and because of their visual characteristic, it is widely used for giving information throughout the world.
The science infographic is the graphical or pictorial representation of the concepts of science. Anyone can easily understand science through the science infographic because the idea is in the visual form in the infographic.
As said above, a human can understand the visual input at the earliest opportunity. An infographic represents its data in the graphic format, which can share knowledge among people.
Consider the example in which you want to share the parts of cells; instead of sharing them in paragraph format, you can break those paragraphs into short lines and represent them with graphics related to them. You can use appealing fonts to write the lines and use the beautiful template to write all the information.
Great Science Infographics
To make your concepts clearer about science, you will see the practical use cases of infographics in this section. You can also take the ideas from the infographics below and use them on your infographics too.
Example 1: Computer Science Infographic

Image Source: access-ca.org
In this infographic, the end-user is getting information about computer science. The first part shows the basic definition of computer science. Computer science is the study of computer and computing applications. Then the information in the form of a graph explains why computer science knowledge should be made available to every child. The infographic shows that computer science prepares students for college, careers, and civic participation. Computing is in all the fields like arts, finance, entertainment, technology, agriculture, health, journalism, etc.
Example 2: Solar System Infographic
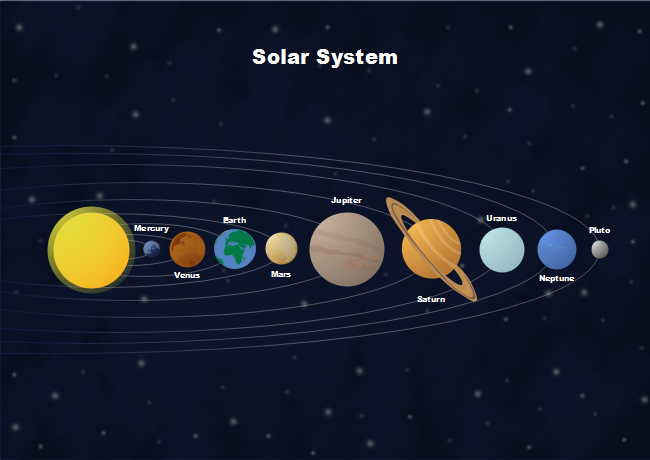
In the above appealing infographic, the information about the solar system is given. The sun is made up of multiple colors, and that is why it appears to be white in our eyes. We can also see that a year on Mercury is just 88 days long. Earth is the densest planet in the solar system. The atmosphere of Venus is made up of Carbon Dioxide and Nitrogen. The infographic also shows that the great red spot is a massive storm on Jupiter.
Example 3: Computer Ethics Timeline Infographic
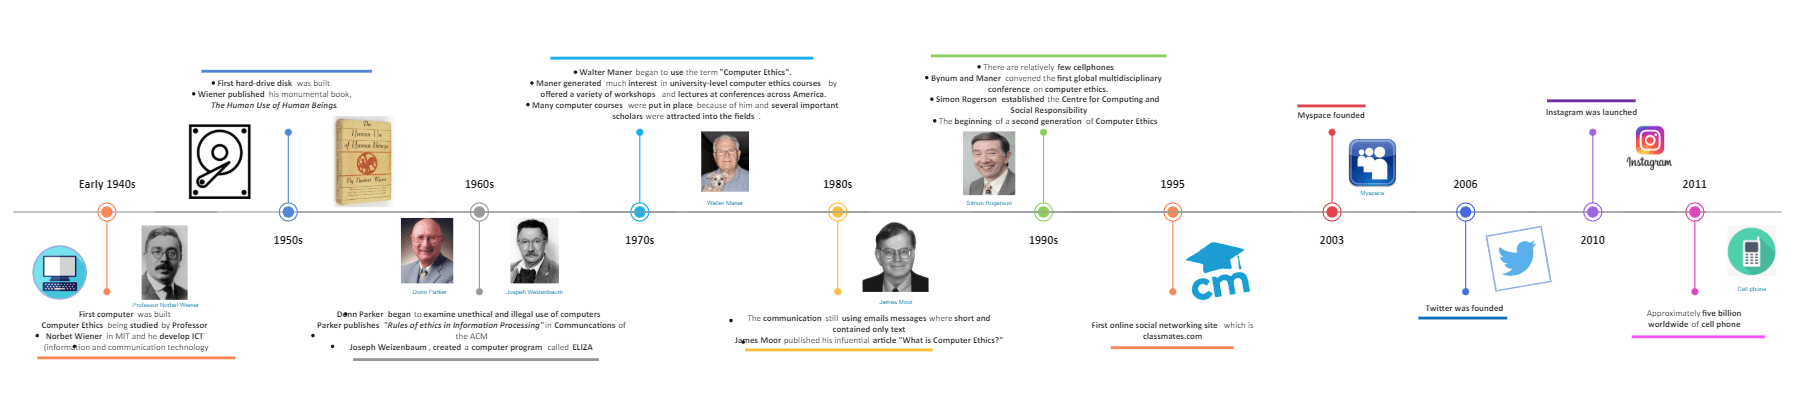
You will get information about Computer Ethics from this infographic. Professor Norbert Wiener of MIT presented the first study about computer ethics. After developing the first hard drive in the 1950s, Norbert launched the book named Human Use of Human Beings. In the 1960s, Denn Parker began to examine the unethical use of computers. From this infographic, we get the timeline of the history of computer ethics and how it evolved with time. Not only computer ethics but email ethics are also discussed.
Example 4: Read a Scientific Paper
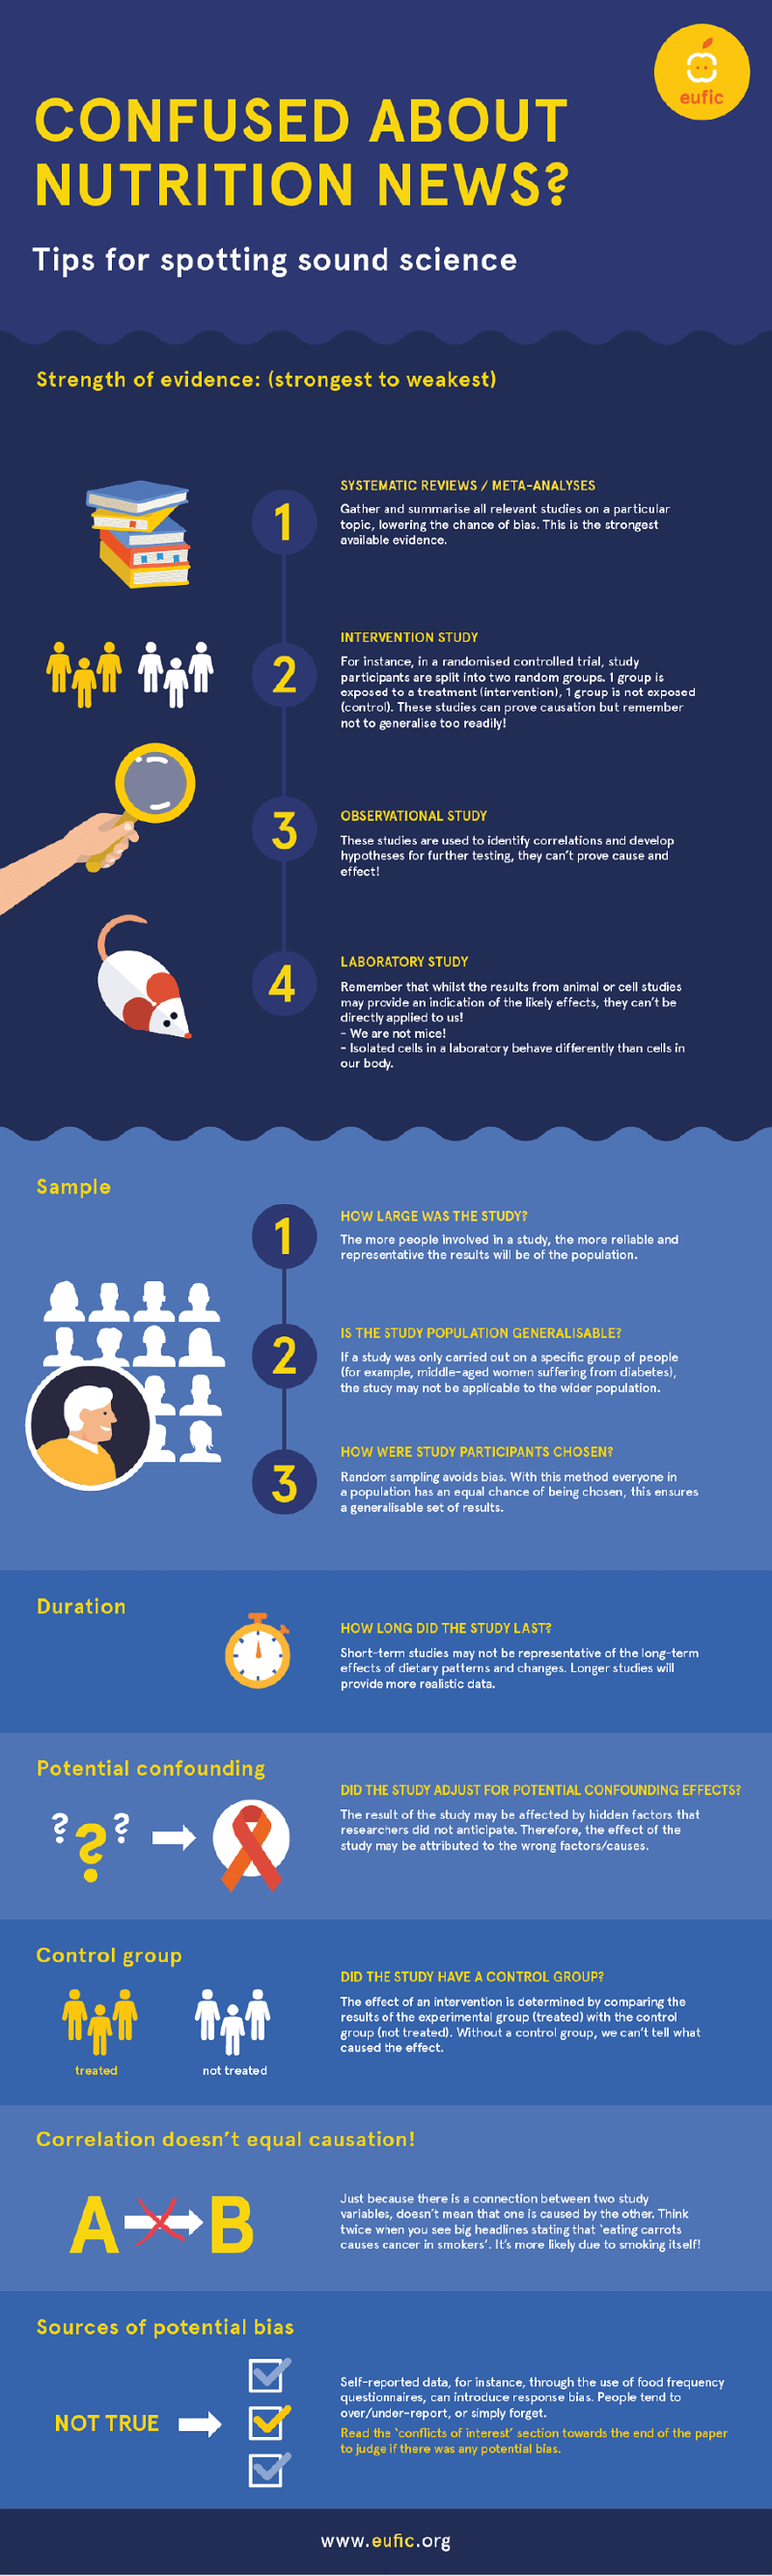
Image Source: www.eufic.org
In this example, an abstract way of making a research paper is given in the form of an infographic. On the infographic, the steps are shown that you can use to make your research paper. The first step is to get systematic reviews and do a meta-analysis. Then you can do an interview study that is interviewing different people and getting their views that will help you in the research paper. Then observational and laboratory studies come, and so on.
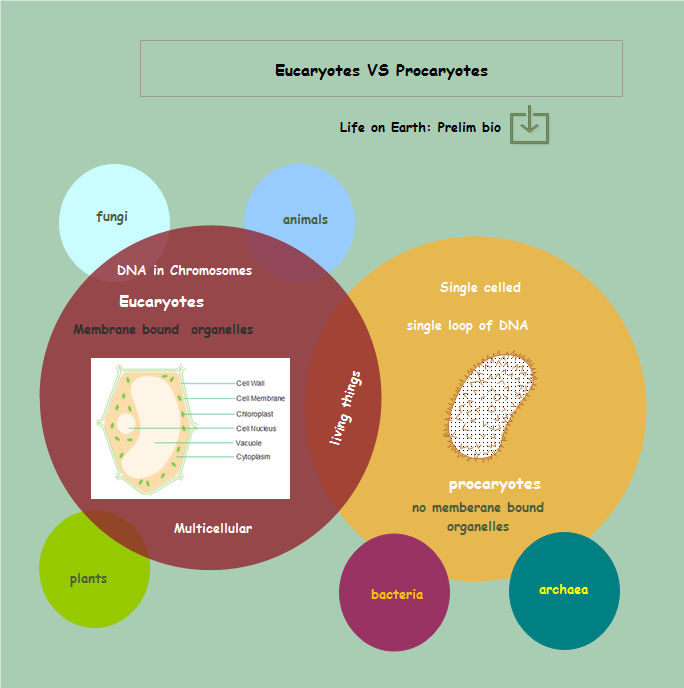
Example 5: Biology Infographic
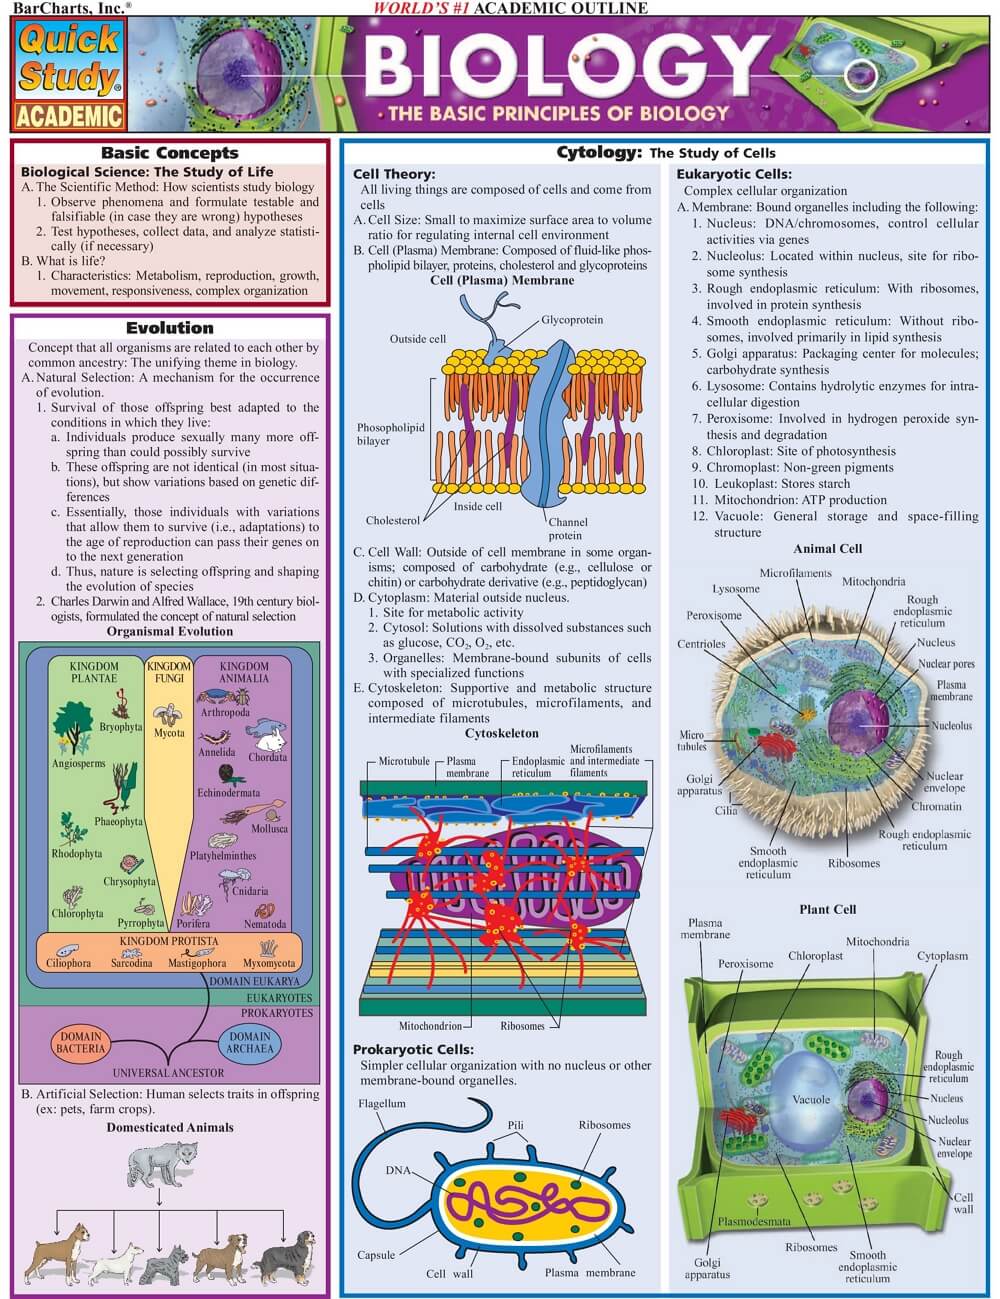
Image Source: www.pinterest.com
The concept of biology can also be given in infographics. In the first part, biology tells about the life and how the creatures evolve. The concepts that surround human life and their internal functioning is also shown. The central part of the infographics shows the study of cells because biology starts with the cells. You can also make an infographic rather than giving information in paragraph form.
How to Create a Science Infographic?
This section will tell you the process for making perfect science infographics. All the below steps will be followed sequentially.
Step 1: Target Audience and your tone
When we talk about science infographics, then the concept of the audience becomes broader. The critical part of communication is identifying your audience because the audience decides whether your communication is successful.
Your audience can be ordinary people, experienced people, students, etc. In the case of students and regular people, you have to set your tone so the audience will understand the message quickly. The people out of your axis are not familiar with you, and you are not familiar with them, so you need to do a lot of hard work to understand them.
Step 2: Choose the title
After knowing your audience, get the best title for your infographics. Your title should be small and concise. The best practice is to make your title a meta description of your infographics, so you have to think in that sense.
Make a unique title that attracts people and showcases what you are trying to deliver. To make a perfect title, you first should know the type of your infographic. Some of the types of infographics are listed below.
- For raising awareness and sharing SOPs.
- For educating people.
- Share some information.
- Do business and marketing.
And there are a lot more. Knowing the type of the infographic will help you to make the title.
Step 3: Gather all the data and information
After choosing the title, gather all the data and information that you will insert into your infographics. It will play a central part in the infographics, so you have to be more concerned about this part.
Be careful about your data. Your data should be precise and reliable. Get the data from reliable books and internet sites. The best practice is to gather data from those sources obliged to produce the data on which you will create an infographic.
For example, to raise awareness about climate change, you will get the data from the weather stations and forecasters.
Step 4: Structure and end interface of infographic
Now, you have to think about the structure of your data. Is your content flowing and is related, or is it different or discreet? A good practice is to insert the data in the hierarchical format if your data is related to each other. Get the best template for your infographics.
Try to add more graphics as you can. Represent your data in the graphical format because people get the number quickly.
Step 5: Recheck and publish
After completing the infographic, recheck it to troubleshoot all the misinformation you inserted unintentionally. After revision, you can publish your infographic.
Why Use EdrawMax for Making Science Infographics?
The best science infographics make data digestible, accessible and visually appealing, without skimping on the relevant facts. How to make elegant and attractive infographics for science effortlessly? The answer is to use pre-made vector science graphics in EdrawMax .
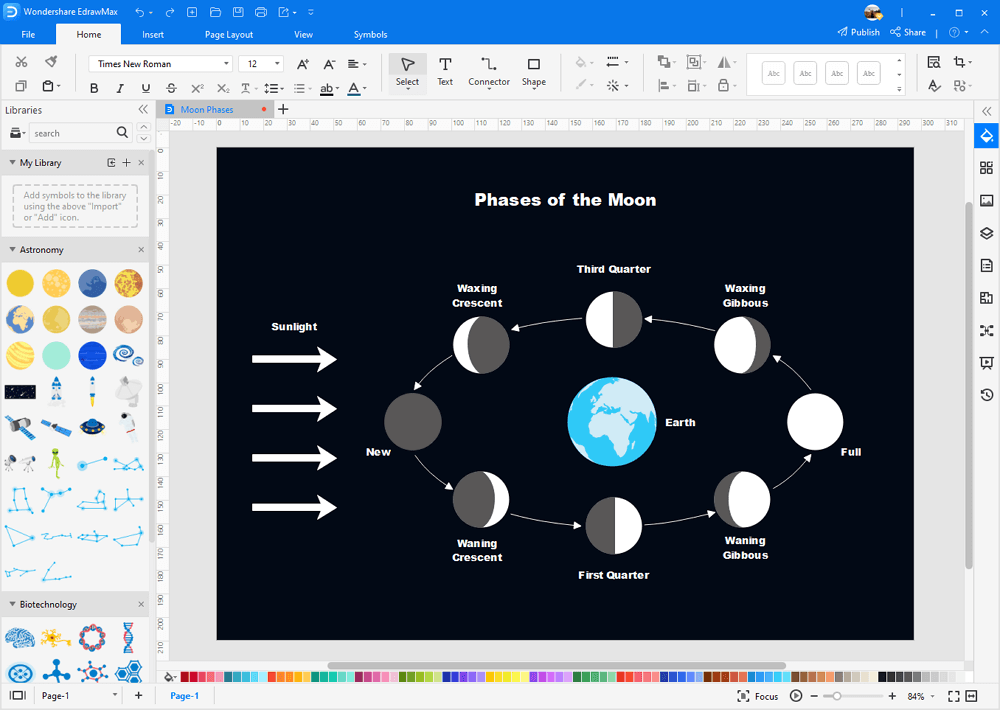
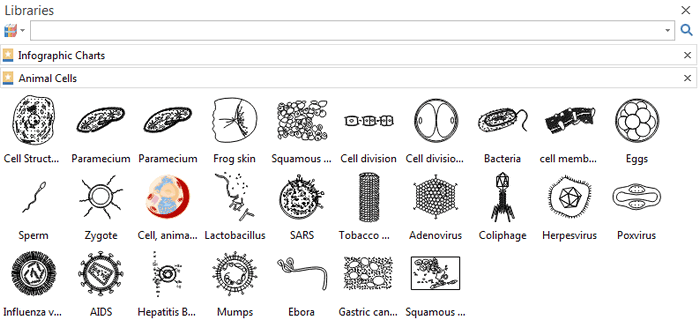
Built-in Vector Science Infographic Elements
After launching EdrawMax, you will have an access to a library of science graphics like plant cell, animal cell, etc. They are vector graphics and can be modified on color and size if necessary.
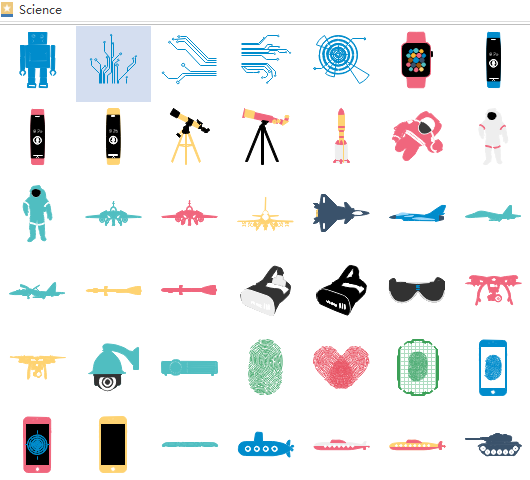
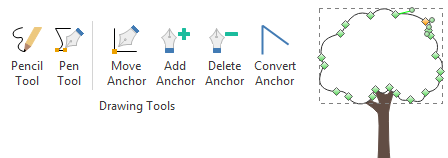
Draw New Elements For Science Infographic
Unlike other infographic tools which are limited to the built-in shapes, users are able to draw custom symbols when they have special requirements via EdarwMax. With the embedded drawing toolkit, you can design any infographic element they like at any time.
Top Features of EdrawMax
- The process is simplified by the "drag-and-drop" function.
- Easy to edit built-in clip arts.
- Supports automatic alignment and spacing. Easy to arrange the layout.
- Be able to draw custom symbols with embedded drawing tools.
- Can insert local images.
- Easy to choose a page size or set a personalized page size.
- Various export options including PDF, PNG, JPEG, Visio, etc.
- A variety of dynamic charts and graphs options.
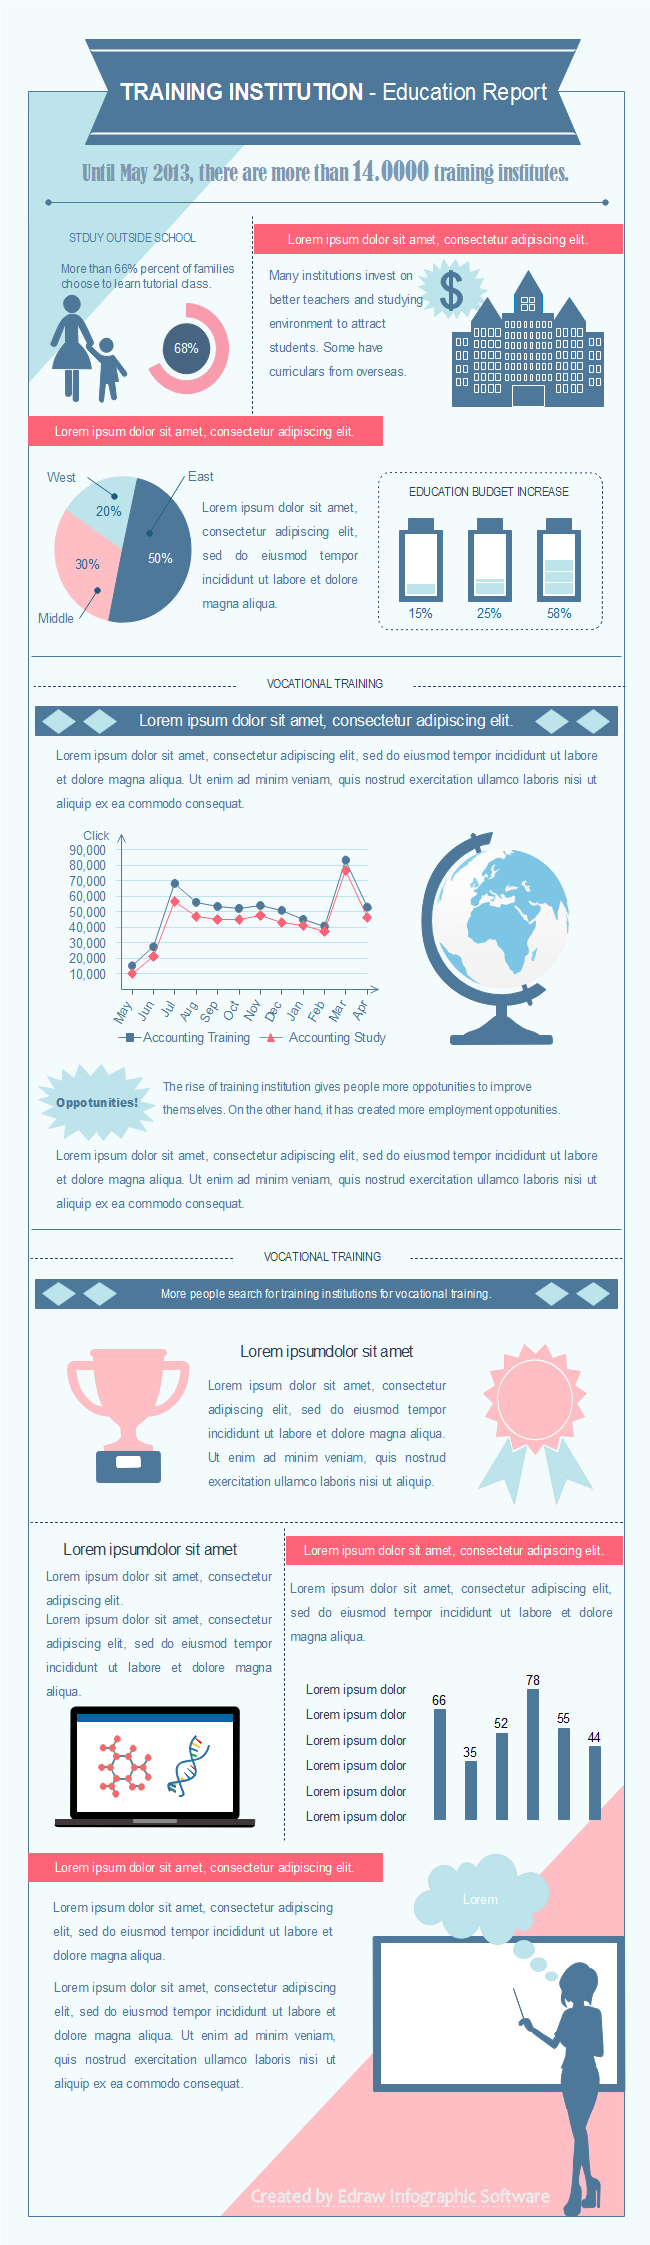
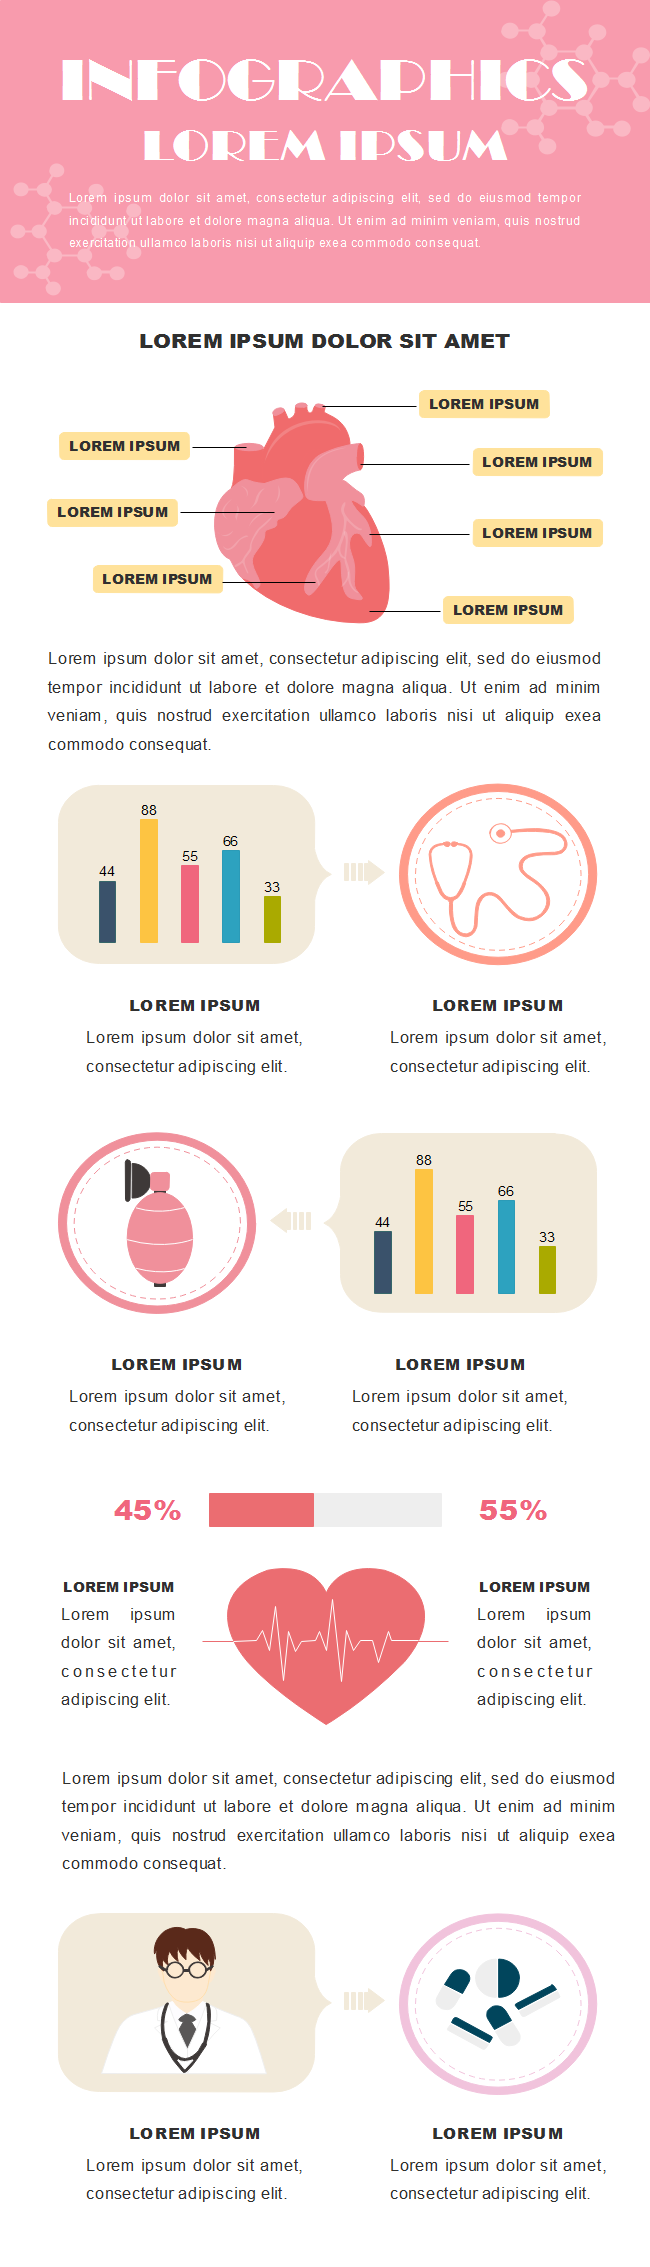
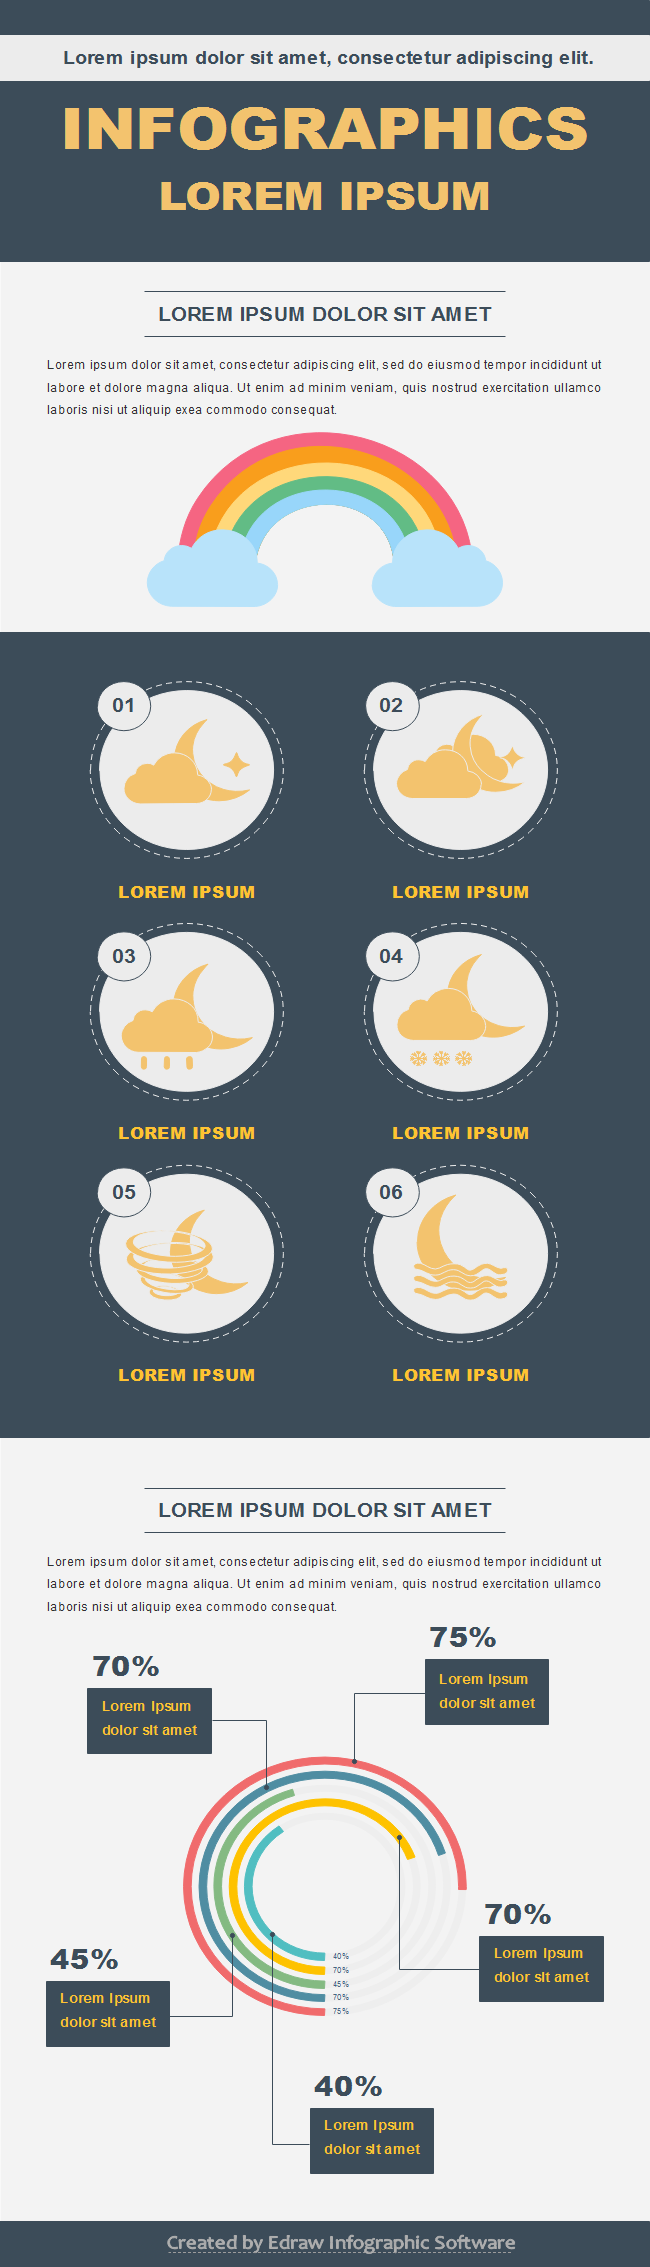
More Free Infographic Templates
Following infographic templates are totally editable. You can use any of them to start and save your time.

EdrawMax
All-in-One Diagram Software
- Superior file compatibility: Import and export drawings to various file formats, such as Visio
- Cross-platform supported (Windows, Mac, Linux, Web)


Edraw Content Team
You May Also Like
Climate Change Infographic
Examples
Mental Health Infographic
Examples
Roadmap Infographic
Examples
Process Infographic
Examples