Best 6 Venn Diagram Maker to Visualize Data

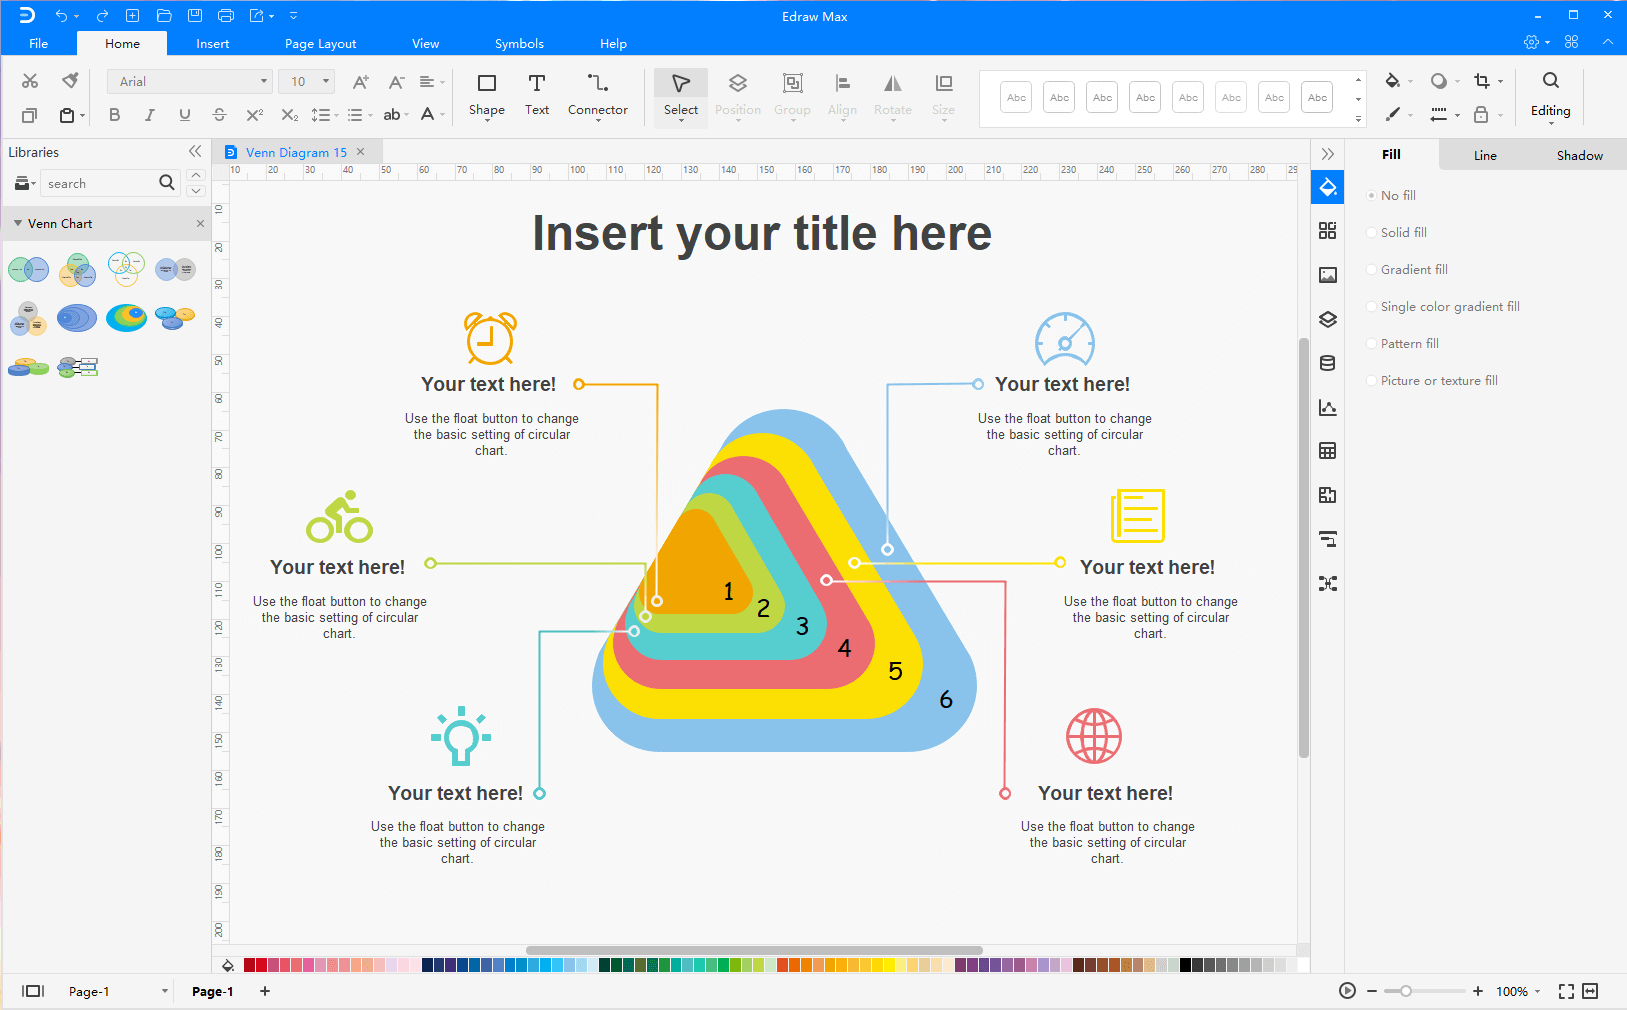
Who doesn’t know what Venn diagrams look like!? Venn diagrams are an interesting way to visualize the overlap between the variables in a data set. Sometimes referred to as set diagrams, these are one of the most essential tools for visualizing logical relationships between two or multiple sets. With EdrawMax - the best Venn diagram maker, you can create all kinds of Venn diagrams.
Venn diagrams are excellent tools used for illustrating relationships, clarifying concepts and facilitating communication. Therefore, these are frequently used in several disciplines and not just mathematics. Besides education, they are extensively used in statistics, linguistics, computer science as well as business. And when you use Edraw’s Venn diagram generator, you can customize the colors, sizes and fonts while simplifying your data.
Best 6 Venn Diagram Maker To Visualize Data
Creating eye-catching Venn diagrams is easy with the best Venn diagram maker. The advanced features of a Venn Diagram software allow you to create any diagram with minimal effort in the shortest possible time. Let’s delve deeper into top diagram software to use.
1. EdrawMax
Key Features
- Easy-to-use diagram maker
- Organizational charting
- Interactive elements
- Drag & drop
- Real-time previews
Pros:
- Intuitive, useful and user-friendly
- All-in-one diagramming software for making understandable and clear material for presentations
- Lightweight and incredibly powerful templates, forms, themes and enhanced effects
- Makes your illustrations more dynamic by linking your data to real-time graphics and exporting them to various formats
Cons:
- Nothing as much
| Supported Platforms | Windows, Linux, Mac, Web |
| Price | Starts from $99 annually, per user. |
| Scores from Capterra | 4.6/5 |
| Link of official website | https://www.edrawsoft.com/edraw-max/ |
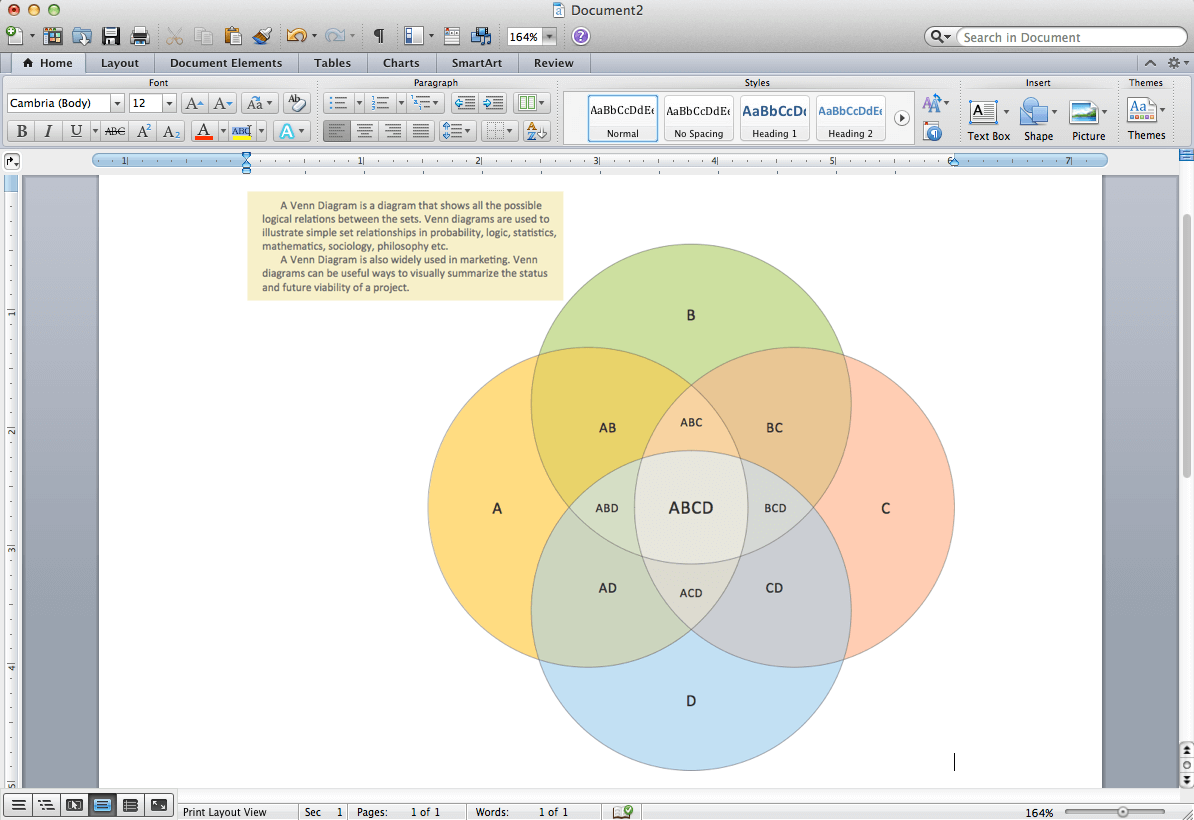
2. Microsoft Office
Key Features
- Advanced presentation features
- Powerful data analysis
- Scalable vector graphics
Pros:
- Universal software
- Easy to use
- Enhanced security
- Tutorials
Cons:
- Navigation
- Stability
- Subscription requires an annual commitment
| Supported Platforms | Windows, macOS, Android, Windows Phone and iOS |
| Price | Office 365 Business starts from $8.25 user/month (annual commitment) |
| Scores from Capterra | 4.6/5 |
| Link of official website | https://www.office.com/ |
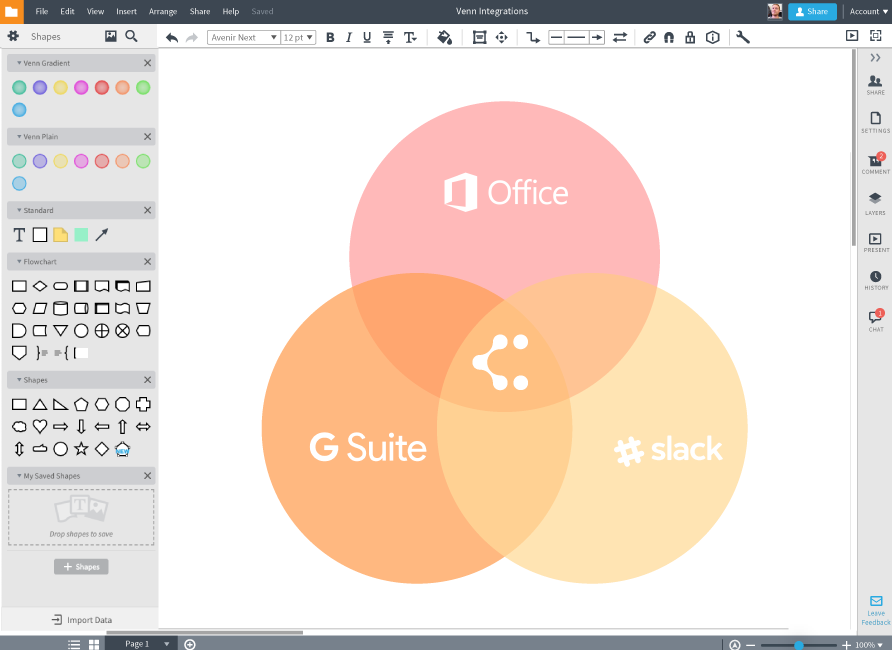
3. Lucidchart
Key Features
- Mind mapping software
- Drag-and-drop capabilities
- Updated themes
- Drag & drop
- Intuitive controls
Pros:
- Ease of use
- Quality support
- Value for money
Cons:
- No desktop apps
- Scaling large flow charts is challenging
- Templates are not diverse
| Supported Platforms | web-based |
| Price | $9.95/month paid annually |
| Scores from Capterra | 4.5/5 |
| Link of official website | https://www.lucidchart.com/ |
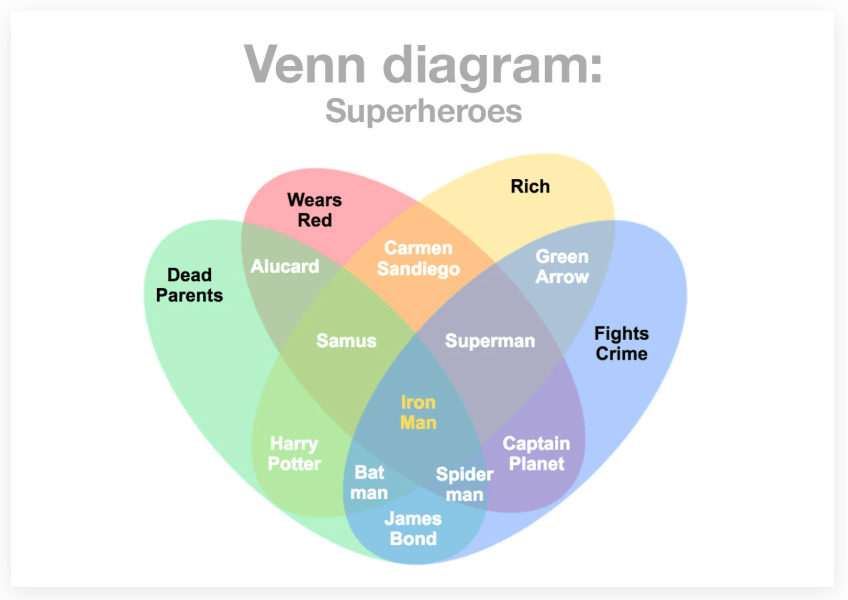
4. Gliffy
Key Features
- Drag-and-drop interface
- Organizational Charting
- Extensive shape library
Pros:
- Easy-to-use tool
- Dedicated customer support
- Friendly user interface
Cons:
- No feature of brainstorming
- Limitation of colour customization
| Supported Platforms | Windows 8, Windows 8.1, Windows 7, Windows 10 as well as all versions of Mac OSX |
| Price | $7.99/month plan billed annually |
| Scores from Capterra | 4.3/5 |
| Link of official website | https://www.gliffy.com/ |
5. Vizzlo
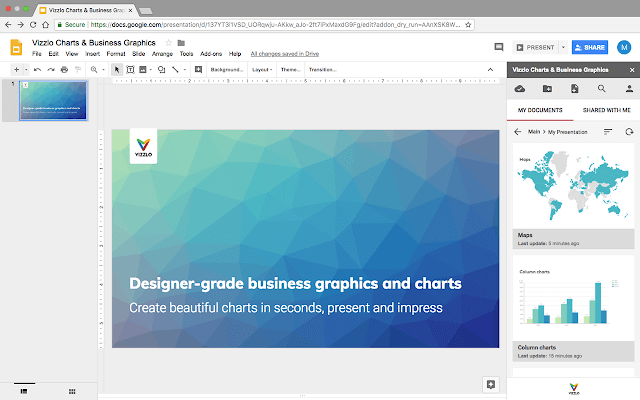
Key Features
- 2-factor authentication
- Pixel graphics
- Vector file support
- Data conversion
Pros:
- Easy to use
- Minimalistic design
- Value for money
Cons:
- Limitation of elements
- Free version files have watermarks
| Supported Platforms | all platforms, including Microsoft. |
| Price | For personal use, Vizzlo starts from $11 per month. |
| Scores from Capterra | 4.7/5 |
| Link of official website | https://vizzlo.com/ |
6. Meta-chart
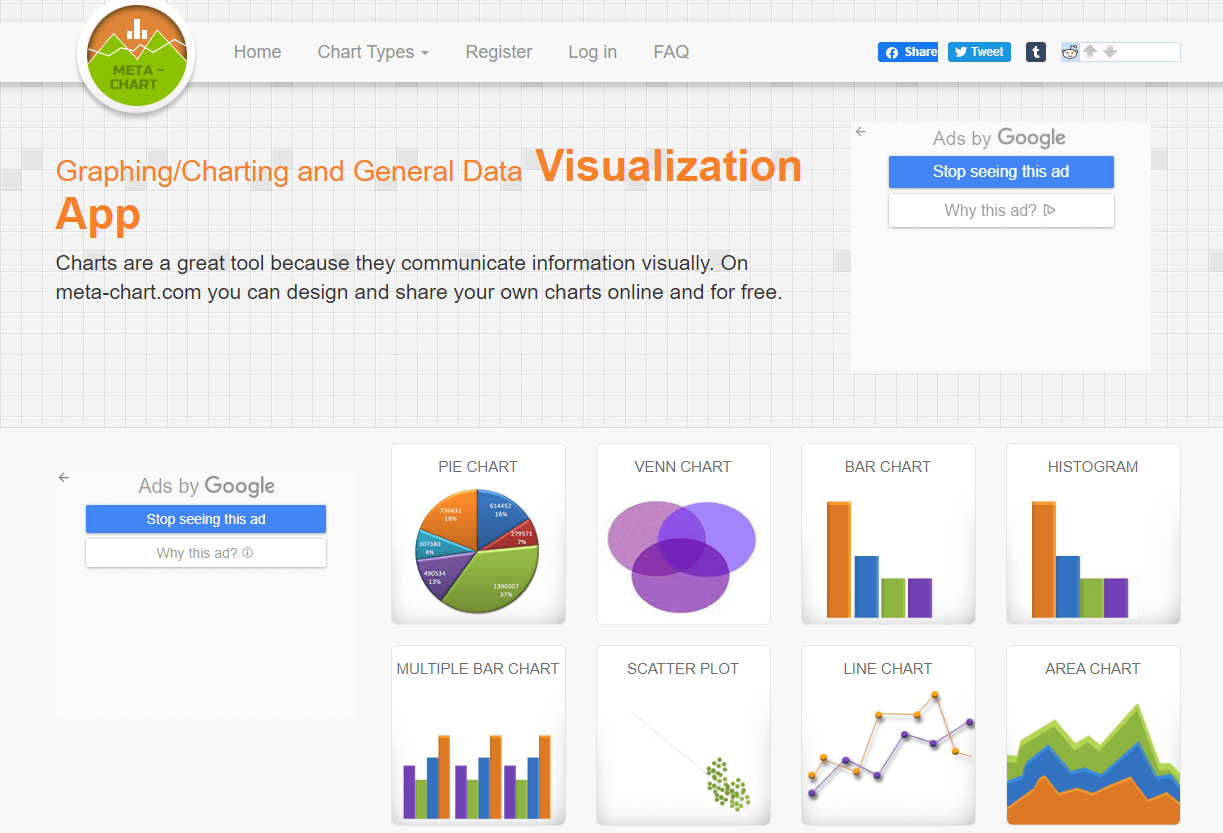
Key Features
- User-friendly interface
- Highly customizable environment
- Automated trading capabilities
Pros:
- Ability to create private shareable charts
- Free charts
- Graphs can be saved and edited anytime
Cons:
- Limited colour options
| Supported Platforms | Supports all popular browsers and compatible across all platforms |
| Link of official website | https://www.meta-chart.com/ |
Venn Diagram vs Euler Diagram
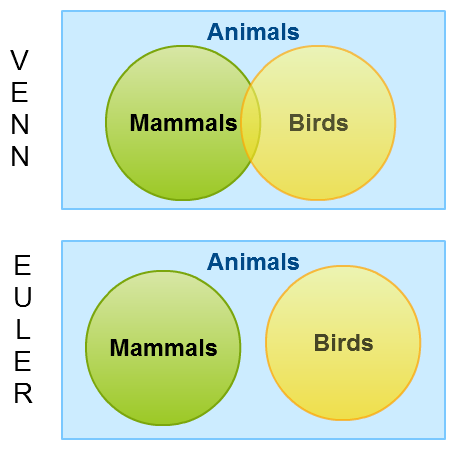
- Venn and Euler diagrams are widely used for the visualization of relationships between data sets. Both these sets of diagrams are based on the set theory. However, a few subtle differences make these illustrations unique.
- Venn diagrams are illustrations which show all kinds of possible relationships between a finite collection of sets. Euler diagrams are graphic depictions which are commonly used for illustrating relationships between various groups or sets. While a Venn diagram depicts logical relationships, Euler diagrams have the intersection combinations which exist in the real world.
- In other terms, in a Euler diagram, you just have to depict the intersections which aren’t empty, while in a Venn diagram you need to show every possible intersection between every set, even if it’s empty. This means that while Euler diagrams depict the relevant relationship between sets, Venn diagrams show all kinds of possibilities.
What To Consider Before Choosing a Venn Diagram Generator?
When creating elemental diagrams by using highly resourceful software, designers are spoilt for choices of different templates, colors and design elements. However, when it comes to choosing the right Venn diagram creator, look for software with a simplistic design that is more relatable and easy to process.
So to prepare for the project consider keeping a few vital factors in mind:
-
Proper Tutorials Is The Key
There are times when even a highly resourceful software can turn vain for having a complicated interface. Even if it may be considered for a multi-featured software to get complex at times, there should at least be simplistic and detailed tutorials to back up the users. Therefore, you must choose a software which comes with a proper guide to using it. -
Free Version Makes Sense
Waste of money can be annoying for busy people, especially students with limited sources of income. So look for a Venn diagram generator which offers a free version, allowing users to familiarize themselves with the interface without having to spend their money on it. Furthermore, with a free version, you won’t have to feel at a loss if the suite doesn’t suit you. -
Space Hungry Software
If you have a computer with tons of disk space you may not need to be very picky. But when it comes to a designer’s or developer’s computer, you can never really have a permanent settlement with storage. So, ensure you opt for an effective Venn diagram maker that offers cloud-based storage or has a browser-supported interface. -
Genuine Reviews And Ratings
With the availability of numerous diagramming software, checking out reviews and ratings is a strategic way to shortlist the best. But this convenience can be disrupted by fake reviews. So ensure you go for trusted sources when checking reviews online. -
Price Is A Broader Spectrum
When investing in the premium version of a software, comparing the prices is a basic concept. But when you are searching for a Venn diagram creator, make sure you also compare the features, lest you end up paying less for fewer features, in contrast to paying a bit more for a lot more features.
Conclusion
Whether you are a beginner or a pro, Edraw Max is the best all-in-one diagramming tool. Edraw’s Venn diagram maker is the easiest way to create Venn Diagrams online. An easy to use online diagram maker, it has all the advanced tools you need to create customizable and beautiful Venn diagrams. Generating a professional Venn diagram couldn’t be any easier!


