What is a Process Flow Diagram?
A process flow diagram is key to the development and management of an industrial production process. Easily check out this guide to explore the concept, advantages, symbols, free templates and more.
Contents
- What is a Process Flow Diagram?
- Process Flow Diagram VS Flowchart
- Why Use the Process Flow Diagram?
- Contents of PFD
- Process Flow Diagram Symbols
- Process Flow Diagram and P&ID
- Related Forms of the Process Flow Diagrams
- More Free Process Flow Diagram Templates and Examples
- How to Plan and Create a Process Flow Diagram?
- The Best Process Flow Diagram Software
What is a Process Flow Diagram (PFD)?
Process Flow Diagram (PFD) is a commonly used chart in chemical engineering and process engineering demonstrating the ongoing production flow of chemicals and other types of equipment involved.
The concept of the process flow diagram was first pointed out by Frank Gilbreth, an American industrial engineer, in the 1920s. In the following decades, process flow diagram has become popular in various forms in the industrial engineering industry and even in the business sector.
Process Flow Diagram VS Flowchart
Process flow diagrams and flowcharts are words used correspondingly and refer to making a diagram that documents a business process. The only difference between these two is that process flow mapping refers to the actual process of creating a diagram; the diagram itself is called a flowchart. In short, we can say that Process flow charts and process flow diagrams are the same thing.
Usage
- The PFD helps to understand the process, model a process, ensure quality control and standards plus increase efficiency.
- One of the vital privileges of flowcharts is the capability to visually represent business process functions to organize, analyze, improve and automate the processes.
- The process flow diagrams can help a user to make the process model in such a way that it describes every step of a process in a clear and explicit manner from scratch to end.
Why Use the Process Flow Diagram?
Generally, a process flow diagram is an indispensable tool in modern engineering application since it can be used in various stages of process engineering: from planning to information management, from capacity management to resource organization, and from decision analysis to cost calculation, etc. Process flow diagrams can also help:
- Clearly observe and monitor the entire production process, such as how many components are included, what are the raw materials etc.
- Re-examine problems, obstacles, the causes of delays and uncertainties during a production process.
- Department managers to deal with information management and documentation, capacity planning of chemical materials, technological development of mechanical equipment and so on.
- Building a new model to improve production efficiency and model an existing process for better understanding or develop a new process.
- Enhance communication and collaboration among various roles within and outside the organization.
- Document an industrial or business project process for better acknowledgement, quality control and training of subordinates.
- Regulate a process for maximum efficiency.
Contents of Process Flow Diagrams
What a PFD will Include?
The process flow diagrams include the shapes and connectors known as Process symbols, which represent a task or action, process, or component. They are also known as an Action symbol and are the most commonly used symbols in process diagramming. Physical installation concepts including indoor or outdoor, room walls, phases and platforms are often documented. Labels and explanations are added to determine important aspects of the process.
For a single unit process, the process flow diagram includes the following:
- Process piping and structure
- Process stream labels
- Major equipment listing
- Operational data like pressure, temperature, density etc.
- Major bypass
- Process stream names
What a PFD will Exclude?
The PFD displays the relationship between major components of a plant and does not show minor details such as piping details and designations, to avoid unnecessary information a process flow diagram, excludes the following information:
- Pipeline types and line numbers
- Minor bypass lines
- Instrumental information
- Instrumentation
- Isolation and shut off valves
- Controllers information
- Maintenance of vents and drains
- Lips and rims
- Aid and security regulators
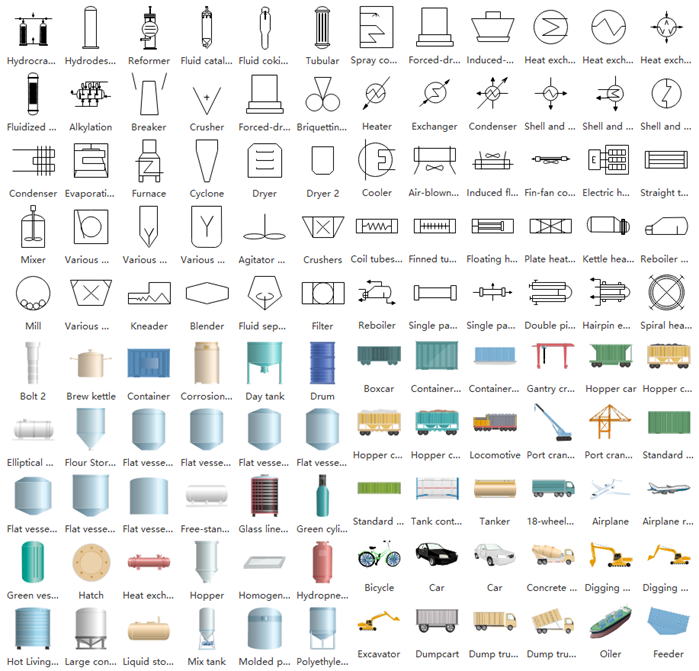
Process Flow Diagram Symbols
You can use either black-and-white or colored process flow diagram symbols as shown below to easily show the functional relationships between system facilities and devices. It is also convenient to transport flluid substances in your diagram by inserting pipes.
Process Flow Diagram and P&ID
Another type of graph that has been mentioned many times with process flow diagrams are piping and instrumentation diagrams (P&ID). These two share some common points but they also have considerable differences:
- Both process flow diagrams and P&IDs contain a series of standard symbols for users to describe a process.
- P&IDs normally include more details than process flow diagrams, since the latter type mainly show the relationship between main equipments. Usually, a process flow diagram includes process pipelines, major equipment items and control valves, etc. However, process flow diagrams generally do not include pipeline grades, pipeline numbers, or secondary bypass lines, etc.
- In practice, process flow diagrams can be used for new employee training, while P&IDs is generally used by process technicians such as pipeline designers, electrical engineers, instrumentation engineers and other technical experts for their production development.
Related Forms of the Process Flow Diagram
Block Flow Chart (BFD)
BFDs can also be used to simplify and decompose process flow systems. Moreover, such diagrams are the simplest form of the industrial flow chart and are usually considered as the first step to complete a process flow diagram. Blocks in BFDs can represent anything from a single device to the entire plant, and links between blocks represent process flows (liquids, solids, gases etc.). BFD is easy to understand, therefore it can be read by users with limited experience in flow charts, or by non-professional industrial operators (e.g. business managers and government agencies officers).
Schematic Diagram
This type of diagram mainly shows a system with understandable graphical symbols instead of real pictures. Such diagrams also omit details that are not relevant to the diagram to minimize visual confusion. In a schematic diagram of the chemical production process, symbols are generally used to represent the equipment of the system and their interconnection paths.
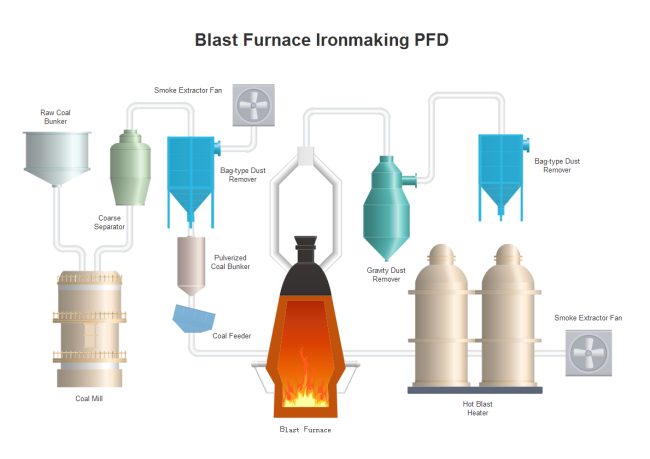
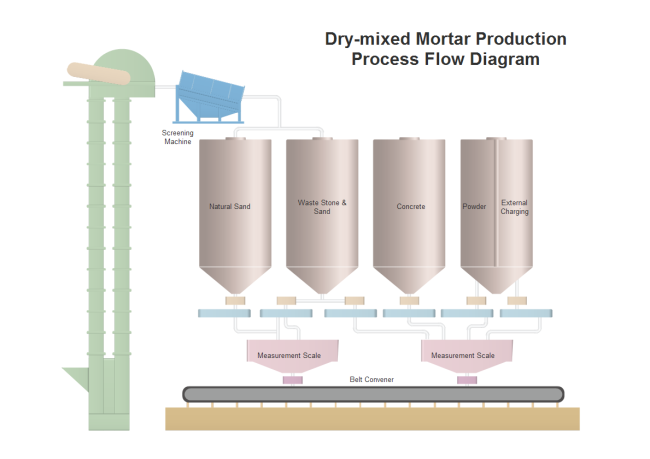
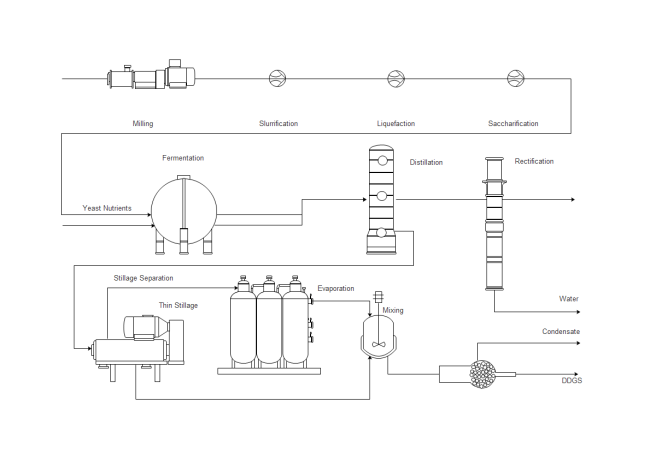
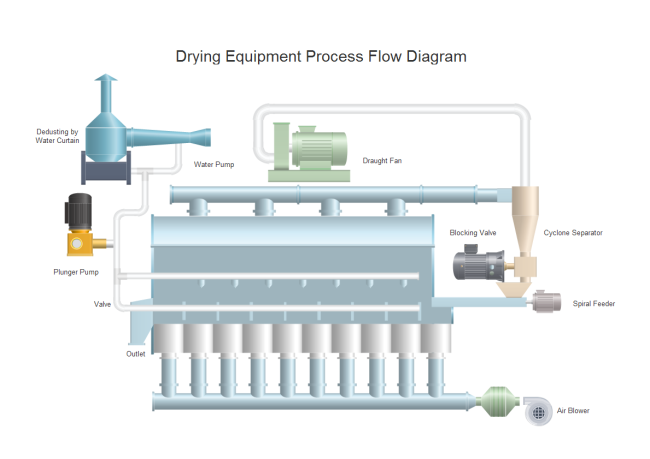
More Free Process Flow Diagram Templates
Here are more templates of process flow diagrams for you to easily undertake your projects. All of these are editable with the free download process flow diagram software. Feel free to click on any of them to see more details.
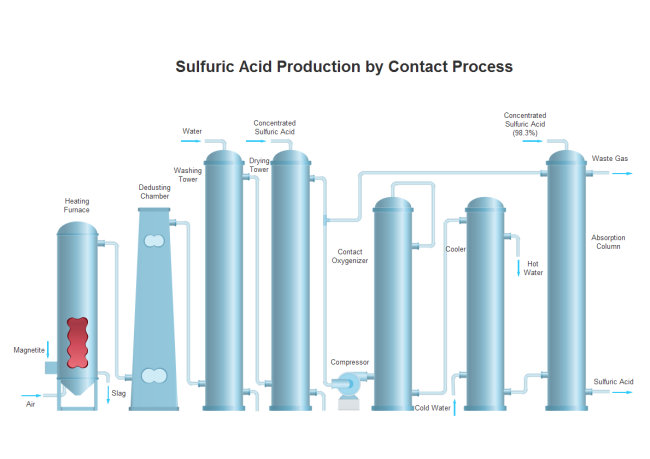


More Free Process Flow Diagram Examples
How to Plan and Draw Your Process Flow Diagram?
First of all, we need to download a process flow diagram maker - EdrawMax
EdrawMax
All-in-One Diagram Software
- Superior file compatibility: Import and export drawings to various file formats, such as Visio
- Cross-platform supported (Windows, Mac, Linux, Web)


In general, you need to follow the following steps to plan and produce a process flow diagram:
Step 1: Set Goals
Identify your research objectives and specific details. In this case, you may need to share updated ideas within your department or with external partners.
Step 2: Do Researches
Research your equipment through detailed observations and interviews. Also integrate any available data sets if you need to model a new process.
Step 3: Summarize and Outline
Summarize all the information you have gained so far and outline the process steps. You can use a note to complete your draft on a large piece of paper.
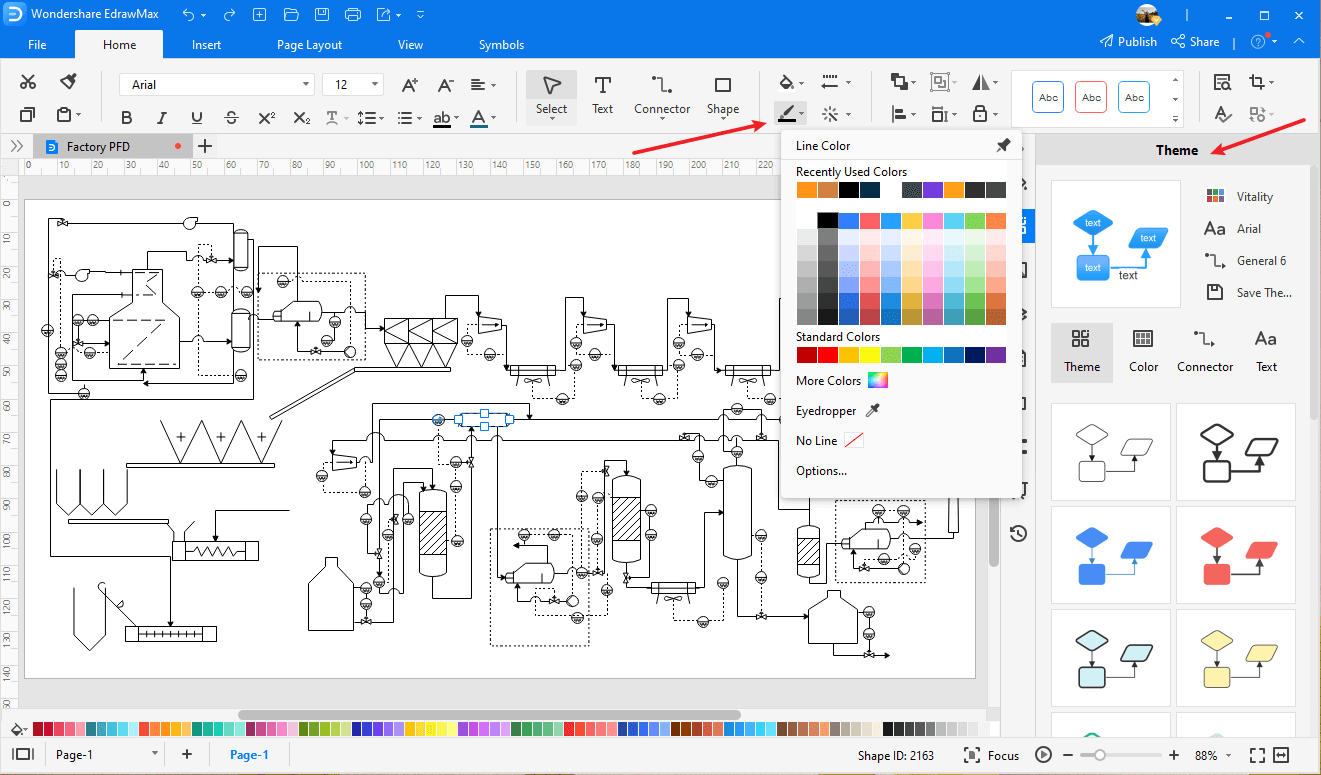
Step 4: Create Your Process Flow Diagram
Use an intuitive professional process flow diagram software to draw more details about your project. Make sure that your entire team is involved in discussing any important changes. You can do the following to build your diagram:
Step 4.1: Drag and Drop Shapes
Drag and drop built-in standard process flow diagram symbols in the library. Alternatively, you can use a preset template to faster your work.
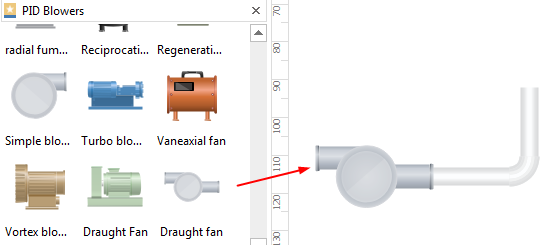
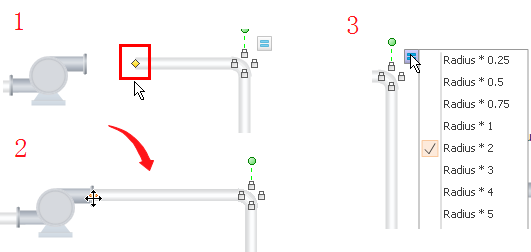
Step 4.2: Connect Elements
Connect process flow diagram shapes and equipment with pipelines in different directions. Adjust the length and width of a pipeline according to your specific needs.
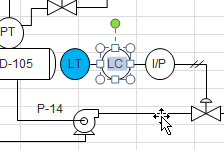
Step 4.3: Edit Elements
Customize your process flow diagram shapes by changing the default color and size. You can further add text to or label each of the equipment.
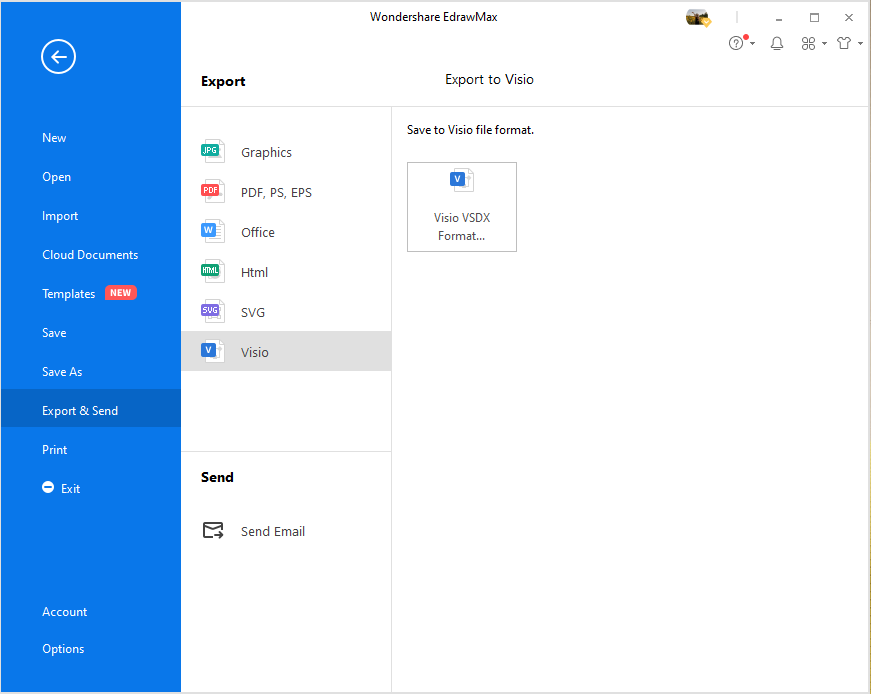
Step 5: Save and Share
Once done your process flow diagram, remember to save it on built-in personal or team cloud to share with other departments for different purposes (such as quality document management, new employee training, etc.). You can also export your files to different formats including PDF, SVG, Visio, Graphics etc.
The Best Process Flow Diagram Software
Use the multi-platform based EdrawMax to create your own professional-looking process flow diagrams. Feel free to enjoy the intuitive drag-and-drop user interface and explore the rich preset categorized symbols. You can also auto-connect, label, or font your shapes quickly by using the built-in auto-create tools. Once finished your work, easily export to many different formats including PDF, SVG and Visio, or save on the Edraw personal or team cloud to collaborate with your colleagues. If you previously used Visio for your work, simply import it into EdrawMax for further improvements. See how easy it can be by clicking on the free download button at the end of this page right now!