What is a Decision Tree?
Contents
What is a Decision Tree?
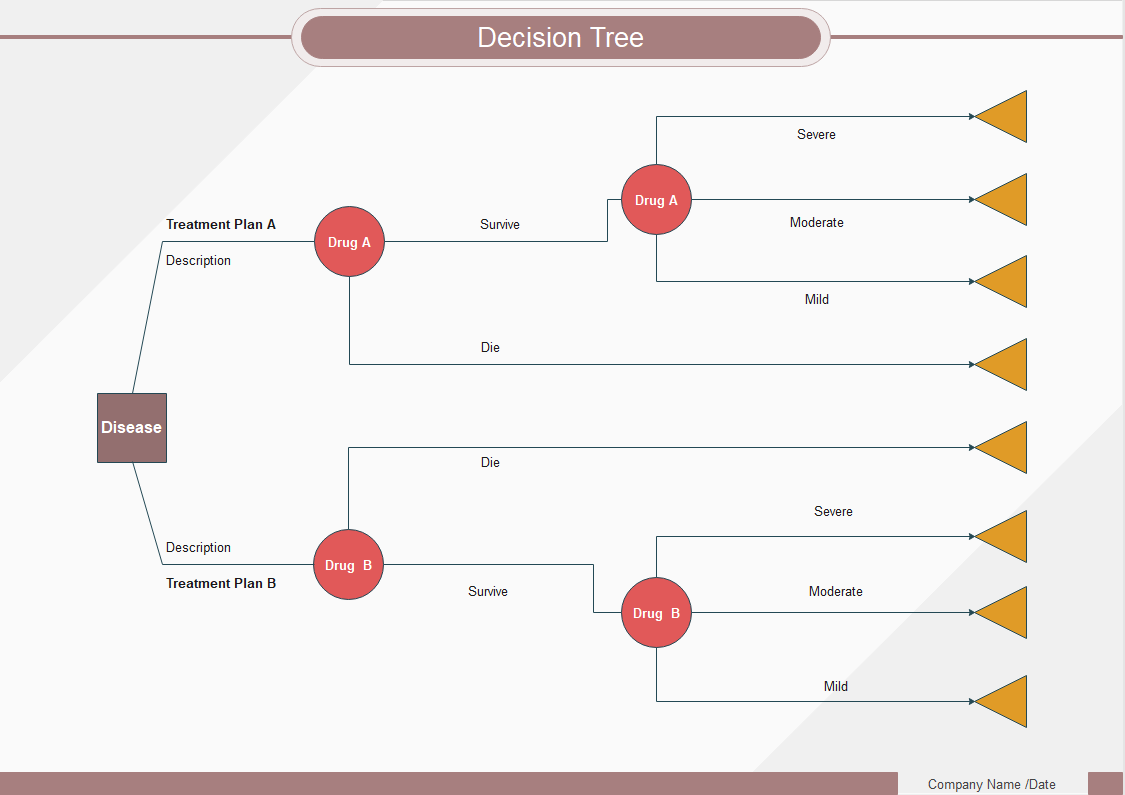
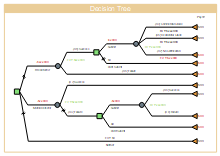
A decision tree is a diagram used by decision-makers to determine the action process or display statistical probability. It provides a practical and straightforward way for people to understand the potential choices of decision-making and the range of possible outcomes based on a series of problems. Decision trees usually start with a single node and then decompose into additional nodes to show more possibilities (such as choosing the two sides of a coin). The farthest branch on the tree represents the final result. Decision-makers eventually weigh each action plan against the risks to make the final choice. Moreover, a tree can be created longer or shorter in length as needed.
History of Decision Tree
The first decision tree was drawn by the Institute of Computing Science of the Poznan University of Technology in 1966. After that, between the early 70s and mid-80s, several improvements in the design of the decision tree were made until the most efficient version of the chart was prepared. This design is now used by many organizations from various industries across the globe.
Decision Tree Key Symbols
Understanding decision tree symbols will help you read a decision tree easily, you need to pay attention to the following nodes and symbols:


What are the Advantages and Drawbacks of Decision Trees?
A decision tree is required when an outcome of a particular action is to be predicted. For instance, if there are several options, and you are supposed to pick anyone, it's the decision tree that gives you a clear picture as to which approach would lead you to what kind of results.
However, as it is with everything else, even such representations come with their merits and demerits. Some of the most obvious advantages and disadvantages of a decision tree are discussed below:
Advantages:
- Ease of Creation
- No Normalization Needed
- No Precise Figures Needed
- Ease of Reading and Understanding
- Effective decision making tool
A decision tree is easy to create as it does not require any specific technical skills or in-depth knowledge of algorithms.
While preparing a decision tree, you don’t need to normalize the inputs, and you can get an optimum prediction merely by adding raw information.
You don’t have to have all the figures and precise data on your fingertips to draw a decision tree. Using generic values as inputs gives you an acceptable prediction that can help you proceed with the most profitable approach.
Because all the information remains in a simple language, it is easy for almost anyone to read and understand a decision tree and develop the best possible solution that further helps make a correct decision. It can be easily used with other decision-making tools.
Large amounts of data can be processed in a specific period when using a decision tree. Both qualitative and quantitative data can be processed with the model.
Disadvantages:
- Sensitivity
- Complexity
- Time Factor
- Uneconomical
- Inaccuracy
A decision tree is extremely sensitive in a way that even a minor modification in input might give you an entirely different prediction and lead to considerable changes in the final results.
If you try to prepare a detailed decision tree, the chart may become highly complex. With the increase of branches, decision trees may contain too much useless data. Therefore, users need to adjust the depth of the decision tree by setting the maximum amount of nodes or integrating different outcomes.
If you are not using an efficient program like EdrawMax, it may take a significant amount of time to create a decision tree as a lot of calculations are to be done manually.
Since there could be several inputs and even more possible situations, preparing a decision tree and educating others about the chart may take a good amount of time, thus costing you more money.
Because no specifics are used while drawing a decision tree, the output that you get could be vague in nature and couldn't be fully relied upon. Further, you are likely to make regular changes to the chart when you start working on the project practically.
Use Cases and Empirical Applications
Decision tree is used in almost all types of industries. Decision tree model has been used especially in the following categories:
Finance and Business Management
The model is taught to business school and Economics students. Individuals or organizations can also evaluate costs, probabilities and benefits by drawing decision trees. Moreover, when a bank provides a loan to clients, it evaluates security through a series of questions based on a decision tree diagram including personal income, working life, credit card records and so on.
Deep learning/Machine learning/Programming
Decision trees can also be used to build automatic prediction models to mine data and evaluate multiple output results. This method is called decision tree learning. In this case, nodes represent data rather than decisions. Sometimes the predicted variables are real numbers, such as prices.
Bioinformatics
A decision tree can help aggregate different types of genetic data for the study of the interaction and sequence similarity between genes. One real-life example is that cancer researchers classify diseases into different types by observing patient data to prevent diseases. In this case, a decision tree is more like a simple and useful classification tool.
Administration
Because several decisions are to be made in an organization in order to keep the flow production run smoothly, the senior management and the people in administrative positions mostly use decision trees to assess the situation. This further helps them take an appropriate approach in the best interest of the company.
Sales and Marketing
For every company, selling a product or service is the main process for survival, and therefore, it automatically becomes important to prepare a foolproof marketing plan to attract as many customers as possible. With the help of a decision tree, the marketing managers can easily assess which approach would be the most productive solution to generate funds.
Manufacturing
Several phases are involved in preparing a complete product. While some goods are made by following a specific procedure that cannot be changed, there are a few things that could use different methods. When a decision tree is drawn for the manufacturing of such entities, it helps the engineers pick the best route that is beneficial for the organization.
How to Create and Analyze Your Decision Tree?
You can choose either create a decision tree by hand or using an easy decision tree maker. No matter which way to choose, you should follow these steps 1,2 and 3 below. Here we are using an easy example to show you the overall process. You can try yourself for more complex cases based on this simple example here.
Step 1: Make Your Initial Decision
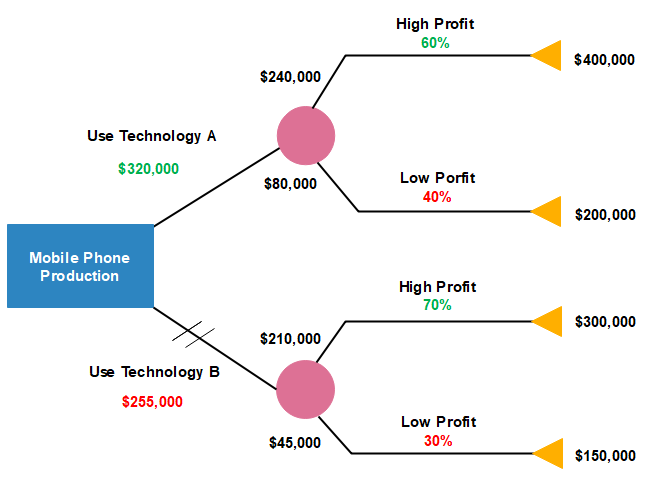
First, you must start with a specific decision for your diagram, for example, choose to use technology A or B for your new mobile phone production. Once decided, create a small square at the left side of your drawing canvas. Next, draw a number of lines from the square to the right side with labels for more possible outcomes. In our example here, you can add the outcome of high or low profit.
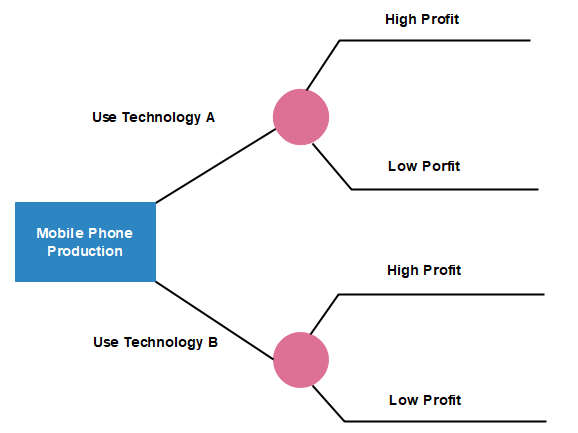
Step 2: Add Chance/Decision Nodes
Continuously expand your decision tree by inserting more decision nodes or chance nodes until every line reaches an endpoint (I.e. no more choices needed to be considered). Leave the space blank if the problem has been solved and add triangles to signify endpoints. Include the possibility of each result if you want to analyze options numerically.
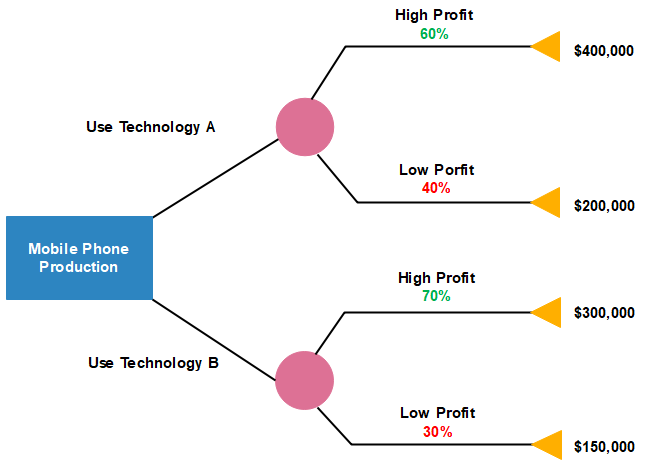
In our example above, the possibility of using technology A with a high profit outcome is 60%, and 40% for the low profit result. The possibility of using technology B with a high profit outcome is 70%, and 30% for the low profit result. You should also predict the most possible outcome for each of the endpoints, for instance, in our example, the outcome of a high profit after using technology A is $400,000.
Step 3: Evaluate Your Decision Tree
Now it's time to analyze your decision tree. Simply multiplying the value of the results by their possibility. Then sum up the total value of each node from right to left on your decision tree diagram to compare and make the final decision. Here is our example, the calculation result is:
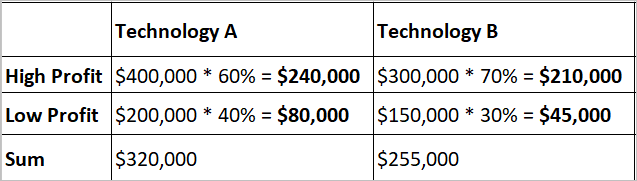
Since the sum of profit of option A ($320,000) is higher than that of option B ($255,000), so in theory, the company should use technology A as their final decision. Also, keep in mind that the risk preferences (low or high risk) of the decision maker may also lead to different final conclusion.
How to Make a Decision Tree Diagram with an Easy Software?
Let's download a professional decision tree maker first.

An all-in-one platform for 210+ diagrams.
・ Simple alternative to Visio
・ 26k+ symbols
・ 10K+ free templates
・ 10+ AI diagram generators


The overall step is quite simple even you don't have any diagram design experiences. Simply follow:
Step 1 - Start Your Work
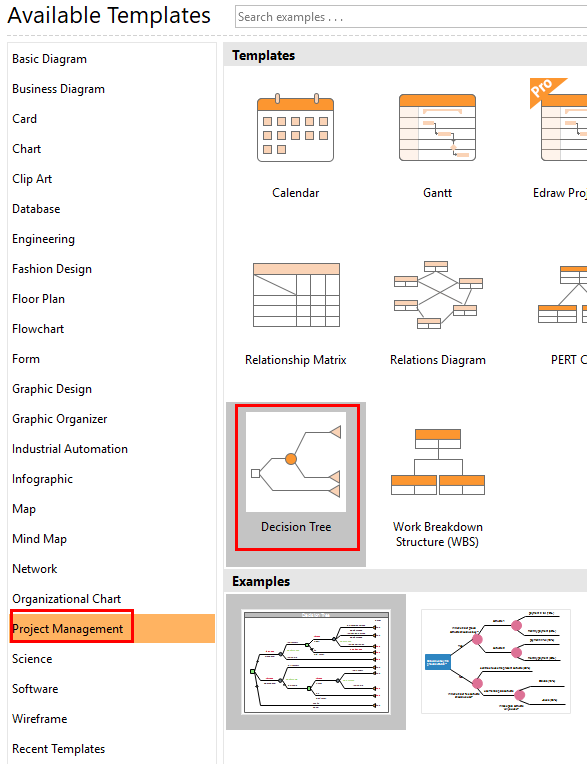
Open EdrawMax and go to "Available Templates" - "Project Management" - "Decision Tree", then double-click to open a new drawing page. Alternatively, you can select one ofthe preset templates for your work.
Step 2 - Add Content
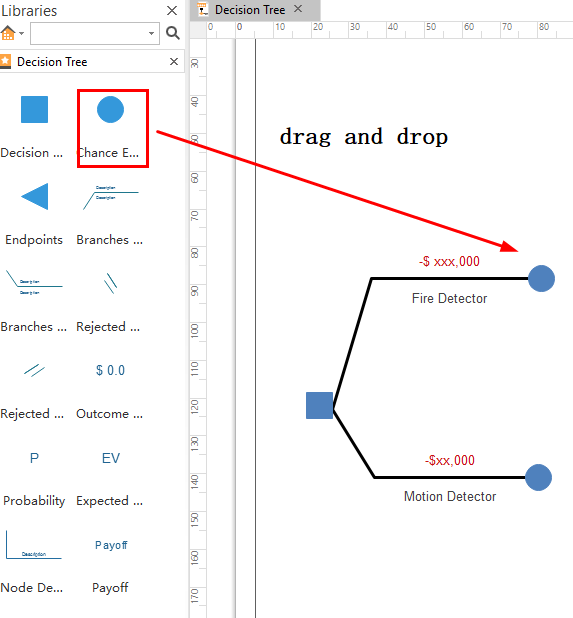
Now you can drag and drop some decision tree nodes and symbols on your drawing canvas to build your structure. Also insert the possibility and branch description details if needed. Further expend your decision tree diagram by adding more nodes and branch lines until you reach the final endpoints.
Step 3 - Format Your Diagram
Next, you can choose to change the default colors, sizes, diagram theme, background image and more to display a better visual presentation. When you have finished your work, you can export, print or share your files within just a few clicks.
Have a Try Right Now!
Now, you would surely understand all the key things about the decision tree. Why not try yourself with a free download software? Simply click on a preset template and then drag and drop any built-in decision tree symbols and node on your drawing board. Also feel free to change the default diagram theme based on the auto-create tools. Once done your work, quickly export to different formats or share on Edraw team cloud to discuss with your team. Click on the Download PC Version and Mac Version at the end of this page to start right now.
Tips for Creating A Decision Tree
Even though a normal decision tree isn’t hard to create, the following few tips suggested by some of the experienced professionals would help you draw the chart in a better way:
- Avoid adding too many inputs (situations) to the diagram as they may produce a vague and unreliable output.
- Make sure to place the symbols at a sufficient distance from each other so the illustration remains spacious and there is enough room to add descriptions to it.
- Use consistent colors throughout the decision tree to make it look professional and trustworthy.
- It would be good if you could use an efficient diagramming tool such as Wondershare EdrawMax to draw a decision tree. Doing so would not only save your time but also help you predict the output more correctly.
- Make sure to share the decision tree with all the people directly or indirectly involved in the project so that everyone is aware of the approach that is being used.
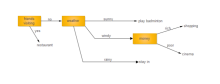
Decision Tree Diagram Templates
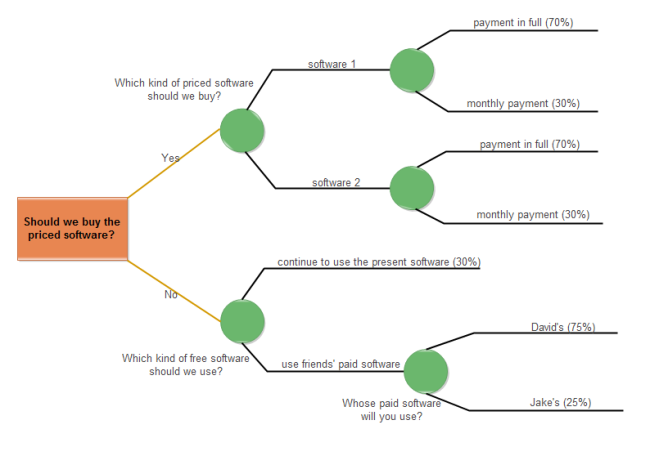
Imagine that you want to try a new mind mapping software for your daily use. There are two options for you: to buy a paid software or download free software. For the paid pathway, you can choose either software brand 1 or 2, in full payment or monthly payment with corresponding possibilities (70% or 30% in our example here). However, if you want to save money, you may choose to use the existing software, or use your friends' paid software (here either David's or Jake's). If David is not busy, then you may have more chances (here is 75%) to use his software. Feel free to click the image to see more and download the original file to expand it based on your own needs.
Free download templates are available below to help your team to create a better decision tree diagram. Click on any of their names to see more details.
|
|
|
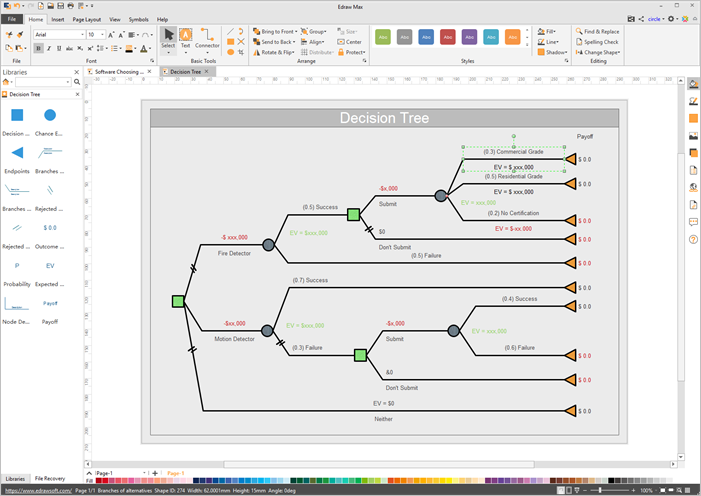
| Simple Template | Industry Application Template | Friends Visiting Decision Example |
Conclusion
The origin of a decision tree goes way back to the year 1966, and during the early 70s and mid-80s, a lot of improvements have been made to the structure. While it is an option to create such a chart manually, it would be a good idea to use a predictive diagramming tool such as EdrawMax that has its own built-in library with all the relevant symbols and icons to make your drawing process easy and quick. The tool also helps you predict the possible outputs so you can take the approach that best suits your needs.
More Related


