Guide on Creating Value Stream Map for Excel
Quick Steps to Create Value Stream Map for Excel
Follow below simple steps and create your TQM diagram for Excel with just a few clicks.
Step 1. Open A Blank Drawing page
Launch Edraw value stream map software, go to the File menu, click New > Business Diagram, then double click the icon of Value Stream Mapping to open a blank drawing page. For quick drawing, users can just choose a value stream map example under Example menu.
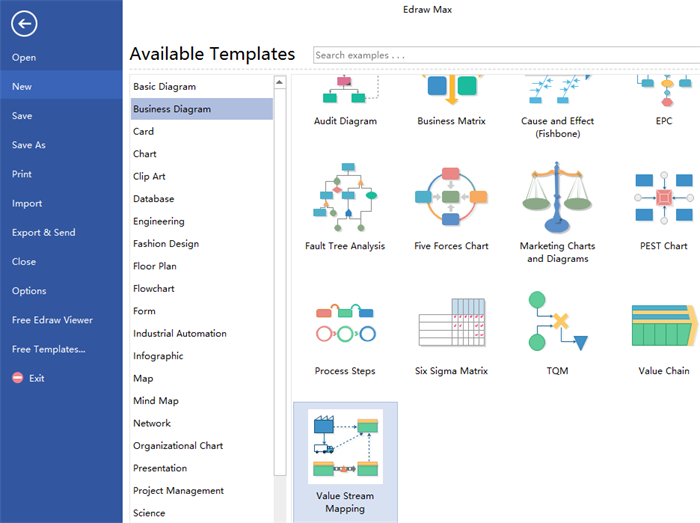
Step 2. Drag-and-Drop Shapes
Switch to left libraries, drag value stream map shapes you need and drop on the drawing page. Users are allowed to edit them as they wish.
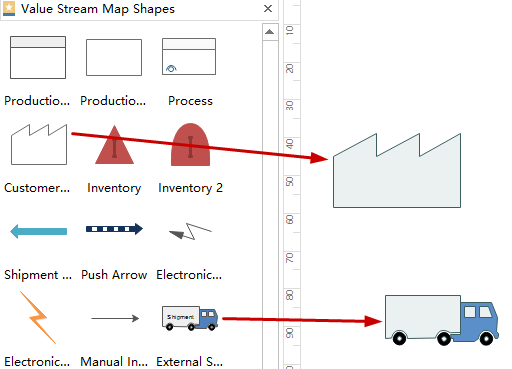
Step 3. Add Contents
Double click the shapes to add key information and click blank area on the page to finish typing.
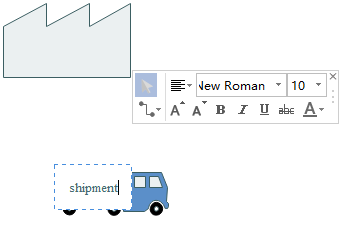
Step 4. Connect Shapes
Click floating button to choose connectors to connect shapes or go to Connector under Home page.
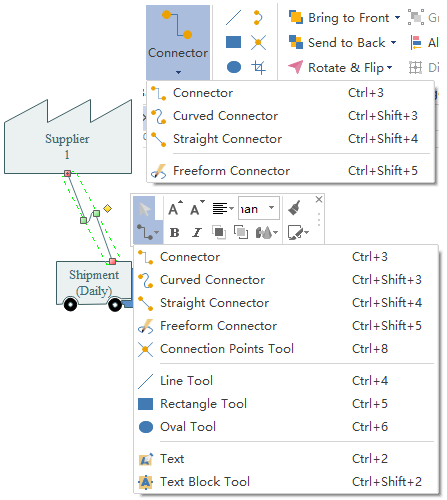
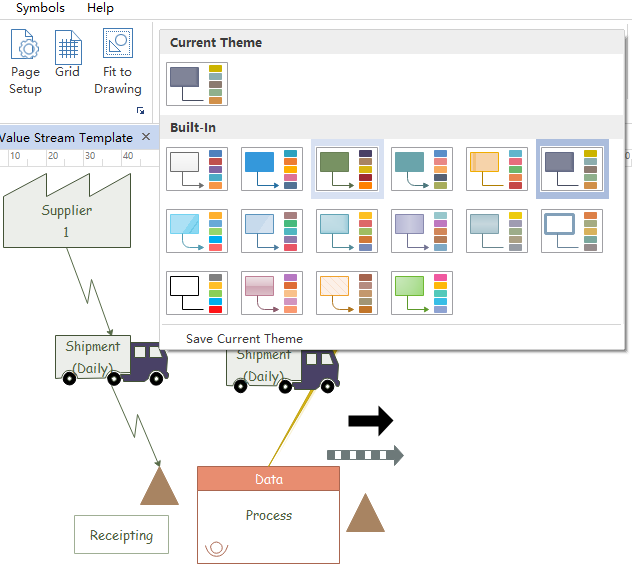
Step 5. Choose A Theme
Navigate to Page Layout and select a theme that matches your diagram best to make it more attractive.
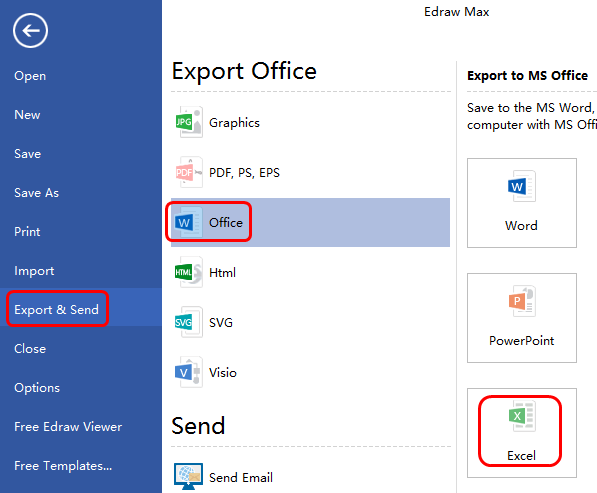
Step 6. Export & Send Diagram
Switch to File menu again, click Export & Send > select Office and click Excel to export the diagram to Excel format, then you can get a professional value stream map for Excel with several clicks.
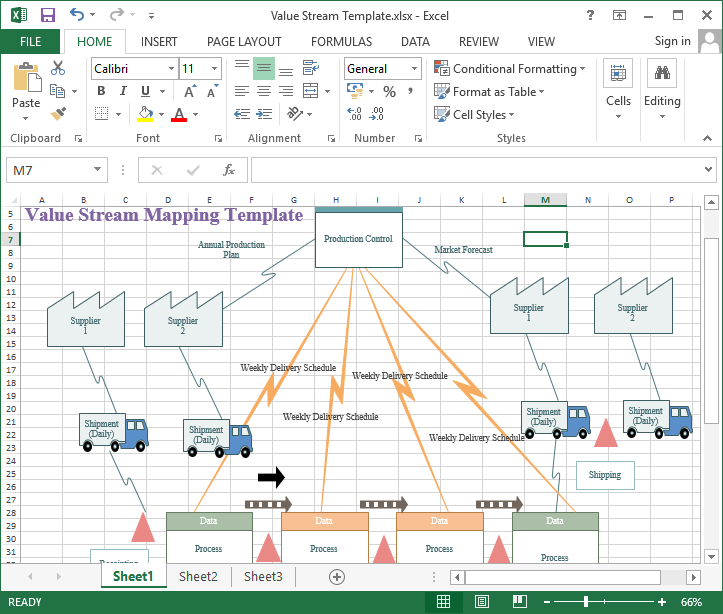
Below is the finished Excel format value stream map. Users are free to edit the shapes and contents, too.
Related Articles
Simple Steps to Create Value Stream Map for Word
Understanding Value Stream Map and Related Concepts
Give Edraw value stream map software a shot. Download and try it for free.


