UML Deployment Diagram
1: What is a Deployment Diagram?
The software systems are divided into various artifacts, and then they are deployed on the physical execution devices to execute the software. This mapping of a software program to physical nodes is described in the deployment diagram.
A UML deployment diagram shows the configuration of run-time processing nodes and the programmed components for these nodes. In simpler words, it shows software system specifications along with the hardware system required to run the software.
The deployment diagram connects the software architecture from the design phase to the physical system architecture in the implementation phase. If the implementation system is in the distributed form, then a deployment diagram is needed to map the distribution of software across the physical nodes.
2: Purpose and benefit
Deployment diagrams are used to model the static deployment view of a system. They are also used in modeling the physical parts of an object-oriented system. The Deployment Diagram also determines the installation of the software on the hardware.
Some salient applications of deployment diagrams are stated here.
- Deployment diagrams show which software elements are deployed by which hardware elements. It describes the software system's specifications and the physical hardware system required to run the software.
- Deployment diagrams illustrate the run-time processing for hardware. UML Deployment Diagram maps software segments of a method to the device that is going to implement it.
- Deployment diagrams provide a view of the hardware system’s topology.
Using deployment diagrams helps stakeholders with a lot of benefits. It clears the communication channels and provides a comprehensive yet concise view of how the hardware and software systems are mapped with each other.
Identify the scope of the model. Does the diagram address how to deploy a version of a single application, or does it depict the Deployment of all systems within your organization?
- You can identify fundamental technical issues with the help of deployment diagrams. It works in pre-empting the problems as well as supports troubleshooting too. Deployment diagrams answer many questions, including:
- How robust is our system?
- What is the interaction and communication model of the system?
- What middleware will be used?
- What hardware or software will directly interact with the end-user?
- You can identify the distribution architecture. The deployment diagram also helps you to determine the approach towards distribution. Here it helps to answer questions like;
- Fat-client approach or thin client approach?
- What distribution will architecture strategy be used?
- Your deployment diagram will identify the types and number of nodes and their connections. You will also make platform decisions, including the hardware and operating systems to be deployed.
3: Deployment Diagram Notations
Deployment diagrams are made up of a variety of shapes. The basic notations of the deployment diagram are explained below.
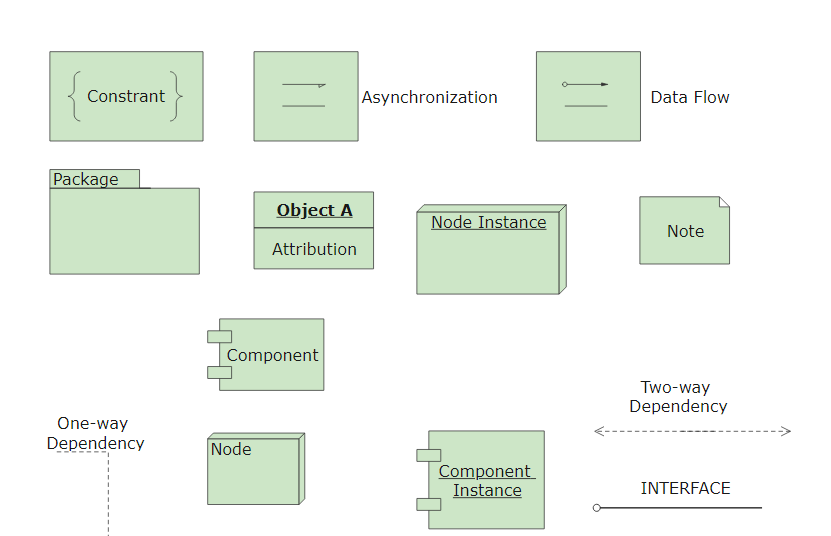
1、Artifact
An artifact is any product developed by the software. Artifacts are concrete elements that are the result of a development process. Examples of artifacts are libraries, archives, configuration files, executable files, etc.
Artifacts are symbolized by a rectangle with the name and the word “artifact” enclosed by double arrows. E.g. << device >>
2、Association
An association is a line that indicates any communication between nodes.
3、Component
A component is a grouping of classes that work together. Different components execute at different times. For example, some components exist only at compile-time; some exist only at link time, some exist only at run time. However, some components may exist multiple times as well.
It is represented by a rectangle with two tabs that indicates a software element.
4、Dependency
A dependency shows that one element is dependent on the other in such a way that a change in one element affects the change in the other element. In a deployment diagram, you can use the dependency relationship to show the capability of a node type to support a component type.
It is represented by a dashed line that ends in an arrow, which indicates that one node or component is dependent on another.
5、Node
A node is a hardware or software object. It is represented by a three-dimensional box.
Node is any computational resource upon which artifacts are deployed for execution. A node is a physical hardware component that can execute one or more software artifacts.
Node is an essential UML element that describes the execution of code and the communication between various components of a system. Nodes help to convey the hardware which is used to deploy the software.
Nodes may have different forms.
- Device Node
- Execution Environment Node
Device nodes are physical computing resources. They have processing memory and services to execute software. Examples of device nodes are typical computers or mobile phones.
An execution environment node (EEN) is a software computing resource that runs within an outer node. It provides services to host and execute other executable software elements.
4: How to create Deployment Diagram in EdrawMax
Here are the steps for the creation of deployment diagrams in the premium drawing software EdrawMax.
Step 1: Start the EdrawMax program.
Step 2: Go to New>Software Development and select the UML modeling tile.
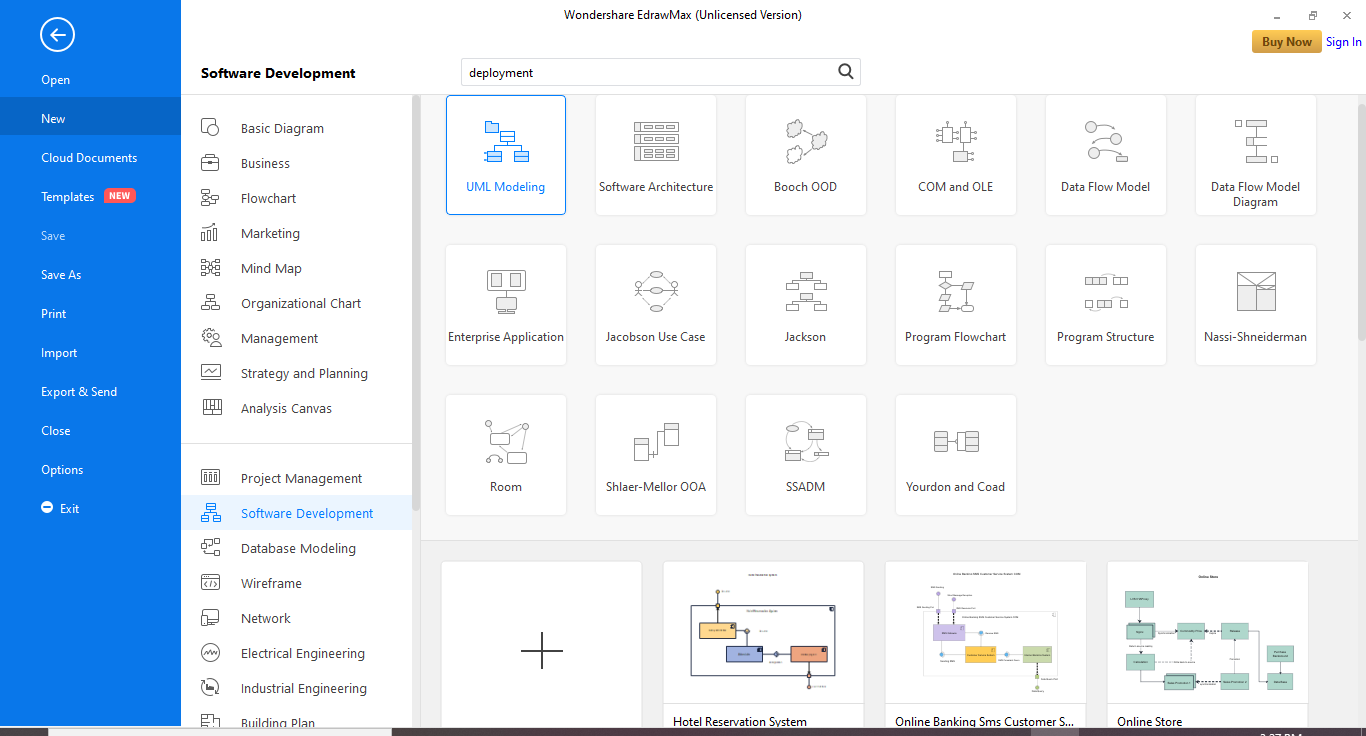
Step 3: In the bottom pane, you can select the deployment diagram template and move ahead with personalized modifications.
If you want to create the deployment diagrams from scratch, then follow these steps instead.
- Start the EdrawMax program.
- Go to New>Software Development and select the UML modeling tile.
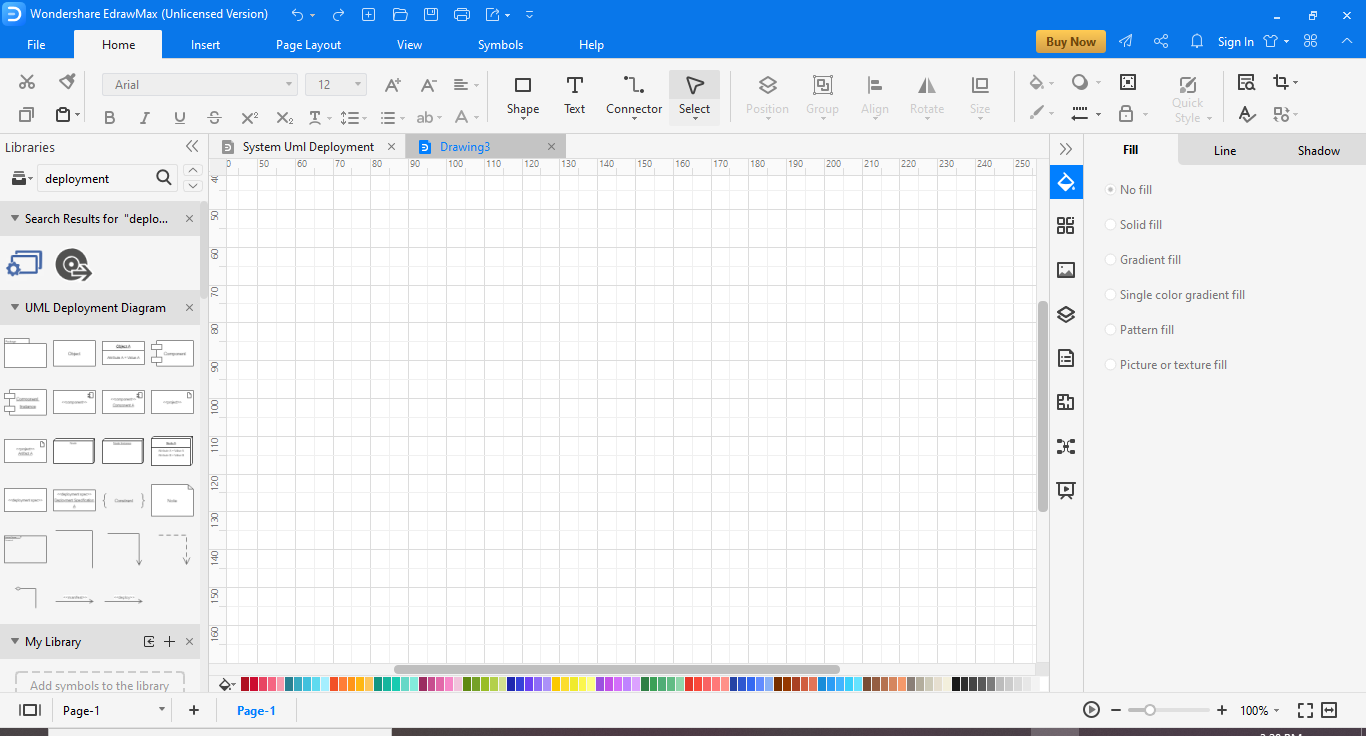
- Now, in the bottom pane, click the plus symbol tile.
- You will have a canvas available on your screen. You can search the deployment diagram symbols in the left pane.
- Drag the required symbol on your canvas and create your component diagram.

An all-in-one platform for 210+ diagrams.
・ Simple alternative to Visio
・ 26k+ symbols
・ 10K+ free templates
・ 10+ AI diagram generators


5: Tips for Creating Deployment Diagram
The pre-analysis of the deployment diagram must be a detailed and thoughtful process. You will make a few points clear before starting drawing the deployment diagram.
- Identify the scope of your system. You should know the scale of your system, whether it is a diagram of a single application or a whole network, or distributed system.
- Explore the limitations of your physical hardware. This is especially important where a legacy system has to be included in your solution. You will adapt to their limitations.
- Identify which distribution architecture you will use. Identify the tiers of your application.
- Describe the communication and connection model of your system.
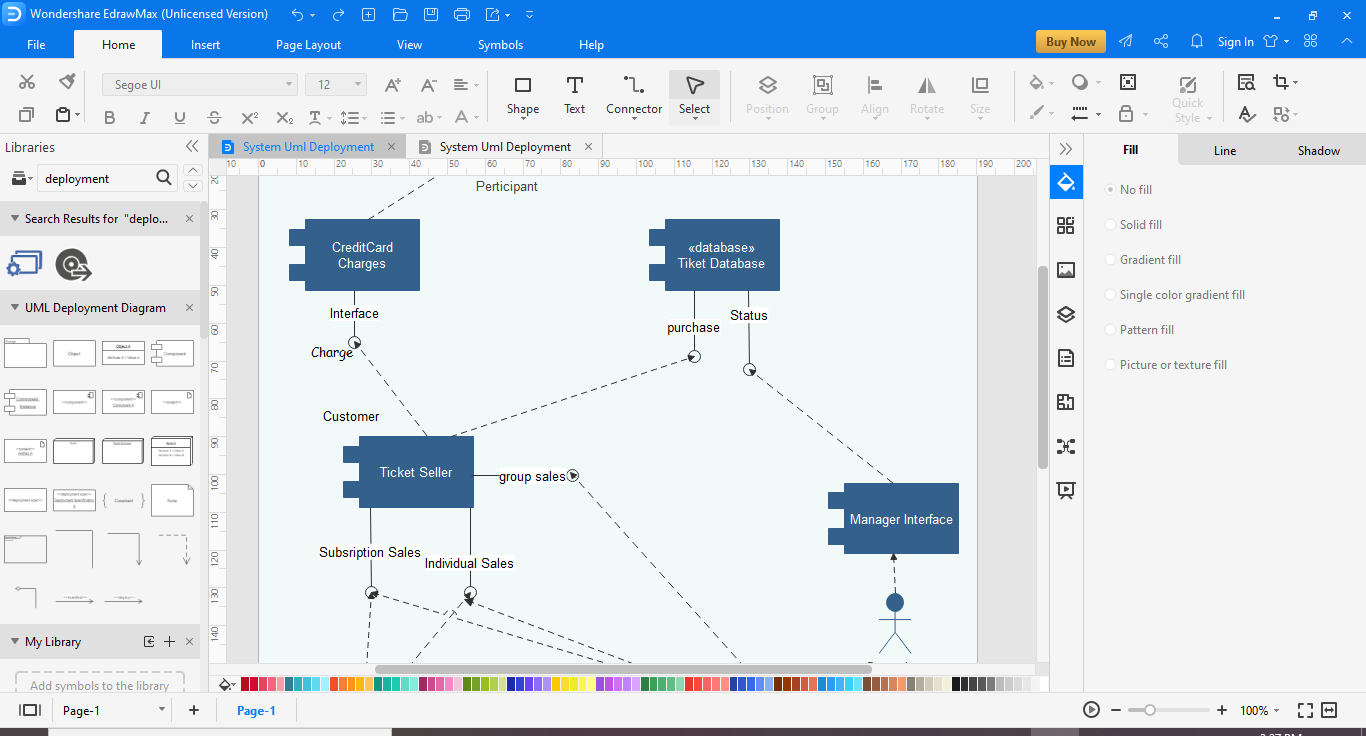
6: Examples
Example 1
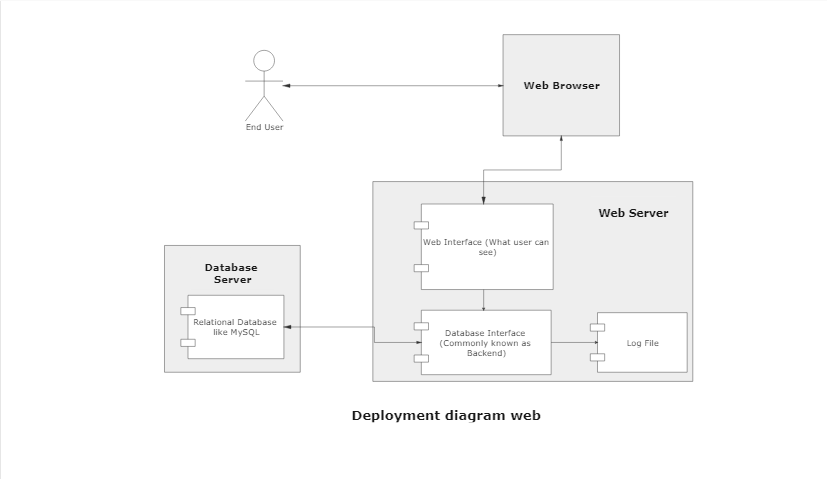
This is a simple example of how an E-commerce platform generally works. It shows the complete cycle of order placement from the end-user to the successful order fulfillment. To successfully place an order, the user will check the available listing on the E-Commerce website's server, which is a component. Then a banking transaction happens, and the database is involved too.
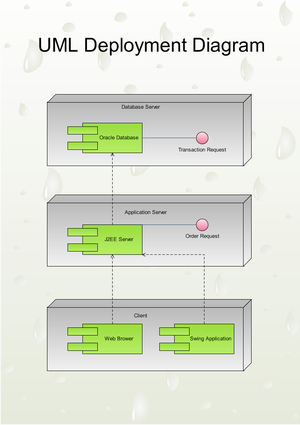
Example 2
Professional UML deployment diagram software with rich examples and template
Read Also:
Free Download UML Diagram Software and View All Examples
UML Deployment Diagrams, Free Examples and Software Download


