Types of Business Diagram - Overview
Discover why Edraw Software is the optimum diagramming solution. Try Edraw Max FREE.
Free Download Diagram Software and View All Examples
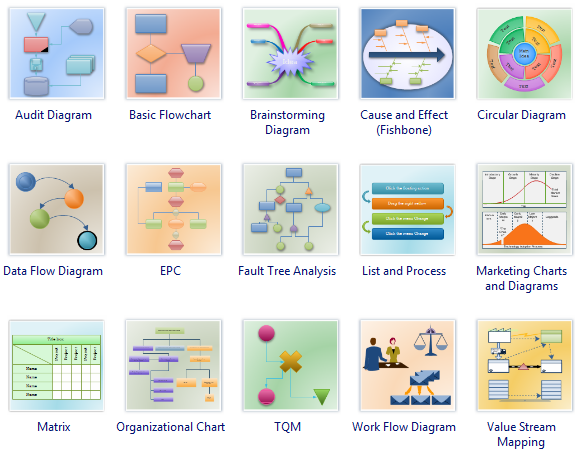
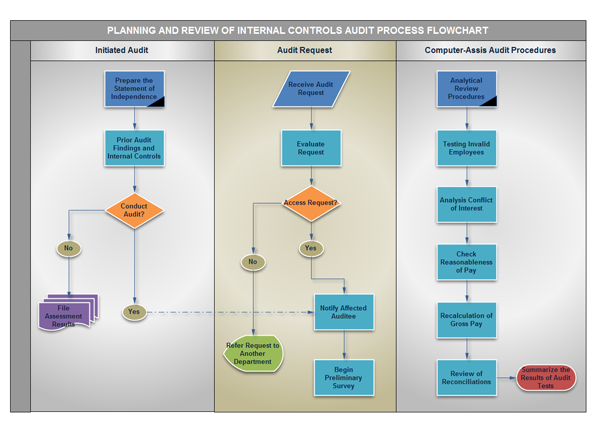
Audit Diagram is commonly used for accounting, financial management, fiscal information tracking, money management, decision flowcharts, and financial inventories.
Basic Flowchart is often used to define and document basic work and data flows, financial, production and quality management processes to increase efficiency of you business.
Brainstorming Diagram is a creative technique in which ideas are generated in order to solve a problem. It is mainly used for brainstorming, problem solving, rational analysis, and decision marking.
Cause and Effect (fishbone) helps you to think through causes of a problem thoroughly.

Circular Diagram helps you draw just about any circular diagrams you can imagine in considerable detail.
Data Flow Diagram is a significant modeling technique for analyzing and constructing information processes.
EPC illustrates business process work flows, and are an important component of the SAP R/3 modeling concepts for business engineering.

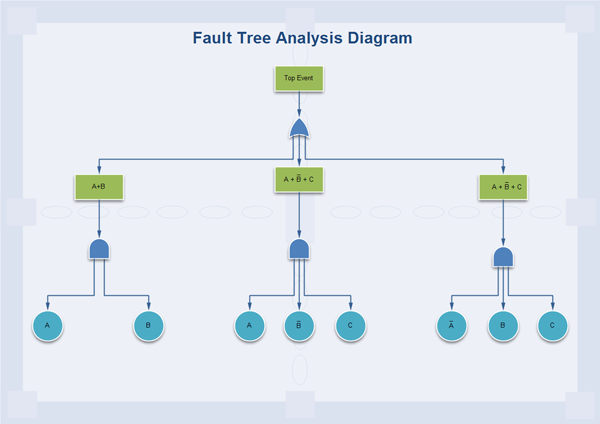
Fault Tree Analysis is a chart of information that shows the relationships of family members over time.
List is used to draw commonly used list, block list, picture list and table list
Process is used to show a progression or sequential steps in a task, process, or workflow.
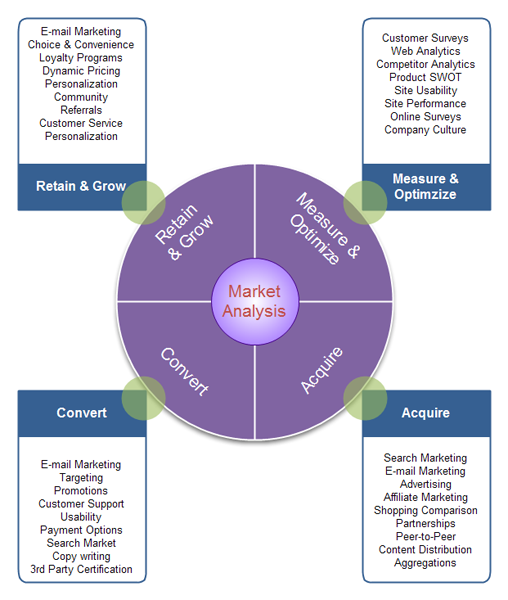
Marketing Charts can be used for simulation and improvement, process modeling, benchmarking, path routing, time and cost analysis, activity-based costing, product portfolios, market and resource analysis, scope and marketing mix, product life and adoption cycles, and pricing matrices.
Matrix Diagram is the optimal diagram type for financial and sales reports, profit and loss statements, budgets, statistical analyses, accounting tasks, market projections and annual reports.
Organizational Chart represents the structure of an organization in terms of relationships among personnel or departments and is the most intuitive way to understand your organization.
TQM Diagram is a comprehensive and structured approach to organizational management that achieves best quality of products and services through using effective refinements in response to continuous feedback, and through using them effectively in order to deliver best value for the customer, while achieving long term objectives of the organization.
Workflow Diagram is designed to create diagrams of information flow, business process automation, business process re-engineering, accounting, management, and human resources tasks.
Value Stream Mapping is a mechanism to improve cycle times and productivity by visually separating value-adding from non-value-adding activities.
General Diagram Types - Overview
Types of Project Management Diagram
Types of Floor Plan


