What is a Tree Diagram
- Part 1: What is a Tree Diagram?
- Part 2: History of Tree Diagram
- Part 3: Advantages and Disadvantage of Tree Diagram
- Part 4: What to do Before Creating Tree Diagram
- Part 5: Tree Diagram used in what fields or areas
- Part 6: How to Make Tree Diagram in EdrawMax
- Part 7: Tips for Making Tree Diagram
- Part 8: Examples of Tree Diagram
- Part 9: Conclusion
Part 1: What is a Tree Diagram?
A tree diagram is a management planning tool that depicts the classification and hierarchy. It can be used with tasks and subtasks, objectives, probabilities, and outcomes, etc. It resembles a tree in presentation hence the name. You start with one single item as the tree's trunk, add branches to it, and sub-branches to show the complete hierarchy. You can have as many levels as you want. As you go deeper, the categories become finer, moving from general categories to the most specific ones.
Part 2: History of Tree Diagram
What is a tree diagram's history? Though we think visual data representations are a discovery, tree diagrams existed even in the middle ages. A trunk with a dense tangle of leafless branches is found from 1552 that classifies parts of the Code of Justinian.
Later in 1859, Darwin used a diagram to depict his theory of evolution. This diagram was called "The tree of life."
The tree diagrams have been used historically to represent the hierarchy and classification of many subjects. They evaluated from the tree-like structures to radials, sunbursts, and hyperbolic trees.
Even today, tree diagrams perform the basic visual representation tasks in almost all fields, especially in chronology, linguistics, probability, and hierarchy.
Part 3: Advantages and Disadvantage of Tree Diagram
What are a tree diagram's advantages?
- 1. Tree diagrams are comprehensive. Whatever subject a tree diagram may deal with, it can represent all the outcomes and trace all the paths to a conclusion. This makes tree diagrams a very relevant analysis tool for decision-making.
- 2. Tree diagrams are also very Specific. You can assign the weightage if using it for decision analysis; you can distance it if calculating the shortest path or probability of outcome if used for maths. Though it might look informal on the first impression, it is a very specific and calculated management tool.
- 3. It is very easy to construct and use if authentic and detailed information about the subject is available. There are no formulas, and the comparison is rather easy. Psychologists think that tree diagrams use the same thinking pattern that humans use to make comparisons and decisions.
- 4. Versatility is a great benefit of tree diagrams. They can be used in any field to assist management. We have seen its implementation in accounts, project management, linguistics, philosophy, and medical, etc.
What are a tree diagram's disadvantages?
- 1. They can become rather cumbersome to use if the number of branches exceeds a certain limit. Therefore, in a very large scope, scalability can be an issue.
- 2. In case of very complex situations where you need to show more details other than just the alternatives and choices, a tree diagram might not help.
- 3. They can also be unstable as adding new branches in the middle of the tree needs shifting the complete structure in the lower levels of the tree.
Part 4: What to do Before Creating Tree Diagram
1. Describe the problem, goal, or objective you are dealing with.
2. You may further expand it by;
a. Asking questions.
b. Breaking down into subtypes.
c. Doing cause and effect analysis etc.
Part 5: Tree Diagram used in what fields or areas
As we already discussed, tree diagrams are widely used in almost all fields in one way or the other. Since we cannot explain all the fields used, we are listing a few use cases here to see a tree diagram's possible implementations.
- It is used to move from generalization to specification. You know the main objective and then proceed to finer details. For example, an organization can be divided into departments like marketing, advertising, management, Quality issuance, etc. Marketing can be further divided into online marketing and physical marketing. Online marketing can have branches like social media marketing and PPC., and this goes on until you reach a point that cannot be further refined.
- It can also show a line of actions and the alternate actions to solve a problem or carry out a project.
- You can use tree diagrams to analyze processes in detail.
- It can be used to find the root cause of the problem. It goes backward from the issue to the root cause.
- It is also a great communication tool.
- Tree diagrams are an essential tool for linguistics. They are used in language studies to study the structure of sentences.
Tree Diagrams are versatile that can be used in several situations. Since it is a visual representation, it can convey a chunk of information without an overload of words. Let us have a look at its benefits.
- They provide clear visualization and are easy and precise to understand.
- Tree diagrams can cover all possible outcomes and trace all paths to a conclusion.
- They can also be used in cost and benefit analysis.
- Scaling the tree diagrams as the structure evolves is very easy. You can go on adding more nodes without any problem.
- They can deal with continuous, non-linear variables smoothly.
Part 6: How to Make Tree Diagram in EdrawMax
We are using a decision tree to illustrate how tree diagrams are made in EdrawMax. You can use the same steps for other types of tree diagrams as well.
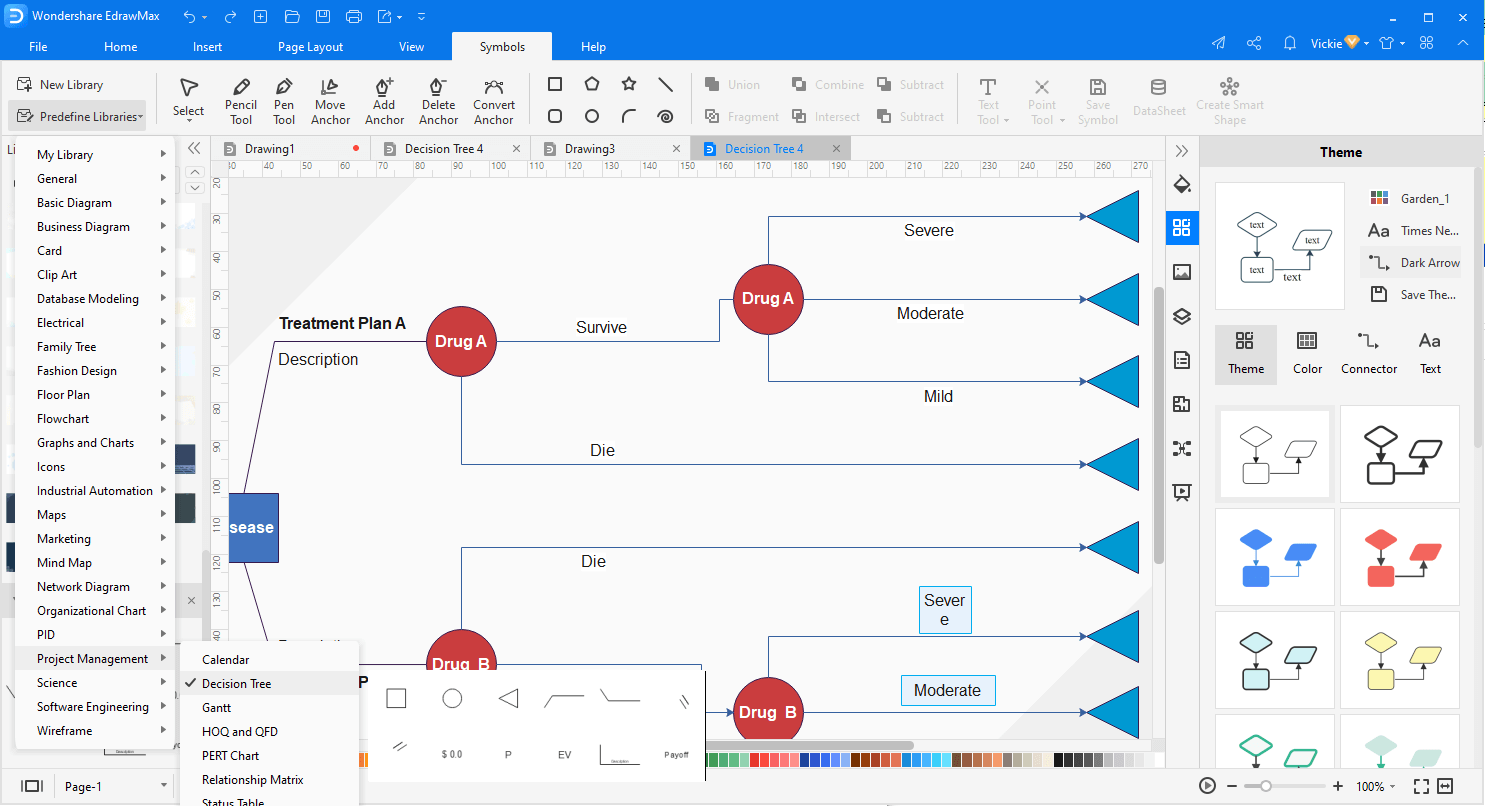
1. Go to New>Project Management in the left navigation bar. On the white-colored navigation pane on the left side of the screen, scroll down to Project Management. Here you can see different diagrams for project management purposes, including Gantt charts, PERT charts, checklist and decision trees, etc. Click on the Decision Tree.We recommend using the free templates provided by EdrawMax to expedite the process. However, you can always draw from scratch as well.
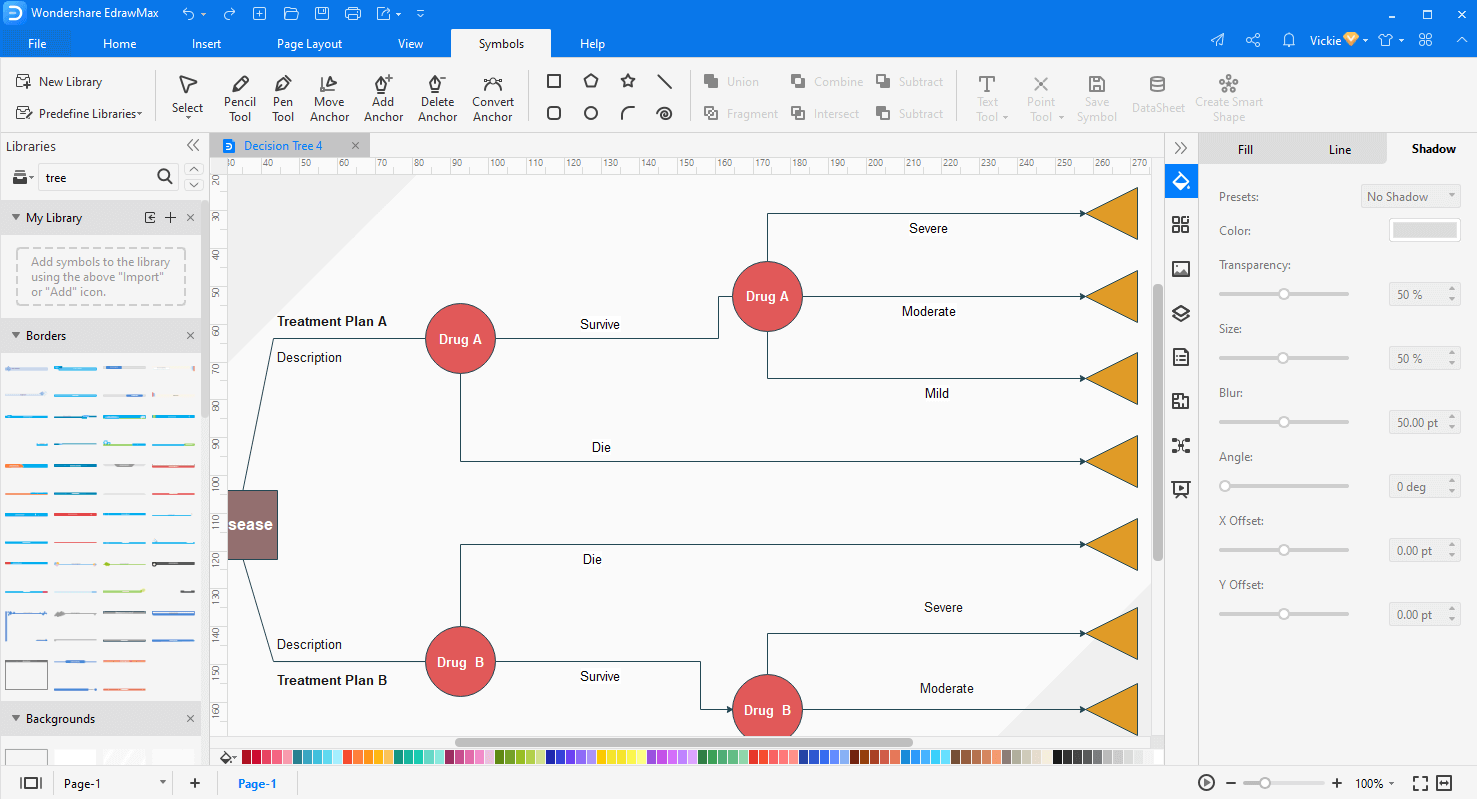
2. You can customize the template to add more nodes, decisions, and relationships to make your version.If you are making it from scratch, select the symbol library from the left side. Search the symbol library for required shapes and lines.
3. You can format and customize your decision tree as per your requirements.
4. Once you are satisfied with the results, save the document.
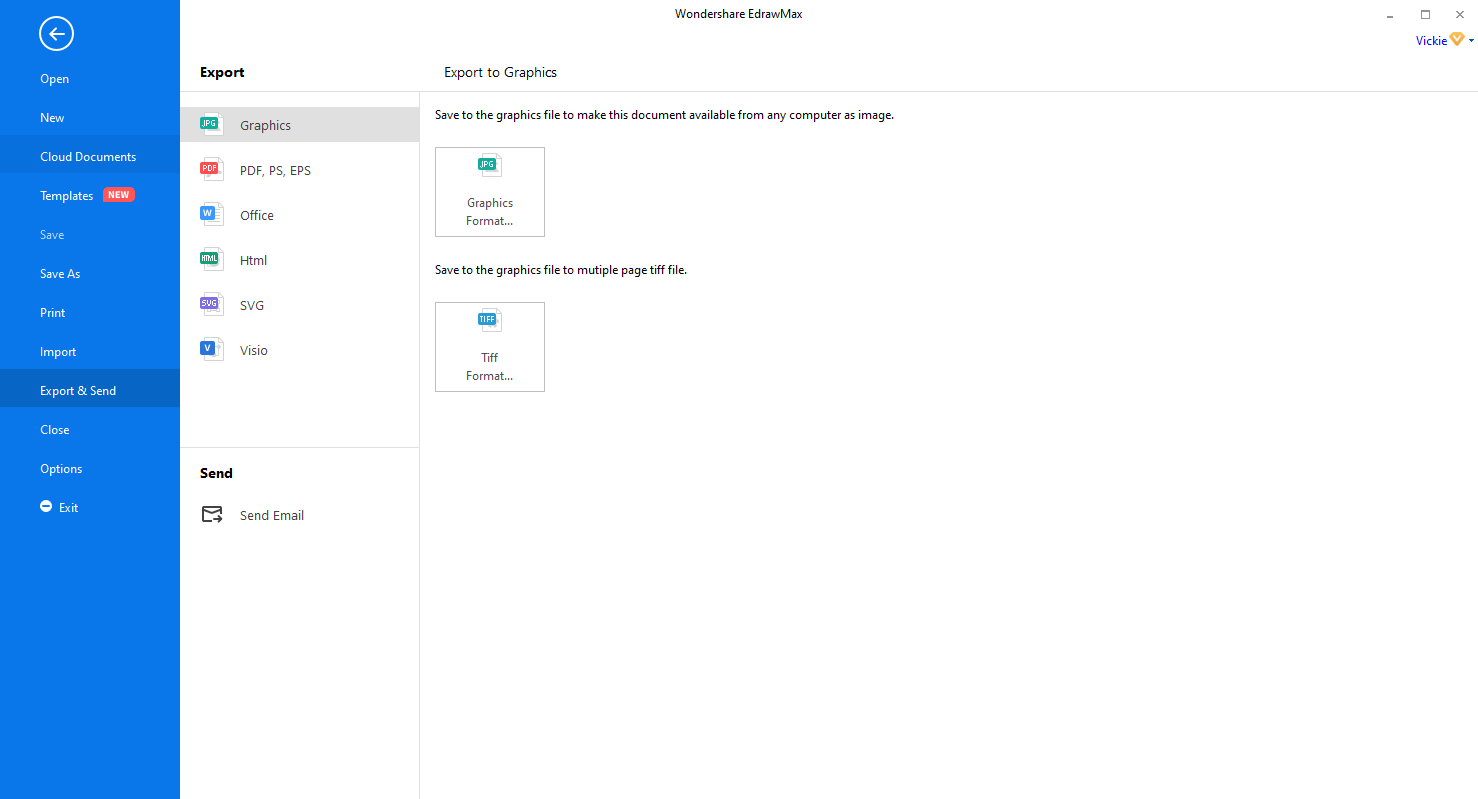
5. Now, EdrawMax allows you to export the document in various formats, including Word, PowerPoint, PDF, and many more.
EdrawMax
All-in-One Diagram Software
- Superior file compatibility: Import and export drawings to various file formats, such as Visio
- Cross-platform supported (Windows, Mac, Linux, Web, Android, iOS)


Part 7: Tips for Making Tree Diagram
- Attention to details is the first and the foremost tip for a tree diagram. As we discussed earlier, updating a tree diagram can be a rather complicated issue. Therefore, being as accurate as possible helps immensely.
- If your tree diagram is becoming too large and complex, breaking it down into multiple trees is a good idea. You can hyperlink the child trees for better readability.
- Use robust software like EdrawMax for making a tree diagram. It makes starting simple with pre-built templates. Updating the diagram is also easier. A software saves a lot of effort in drawing and formatting the diagram. Also the distribution of the document becomes fairly convenient because you can export the file in many formats to make it accessible to a large range of audience.
- Brainstorm all the ideas before starting the tree diagram to have sufficient information to start the drawing.
Part 8: Examples of Tree Diagram
Example 1
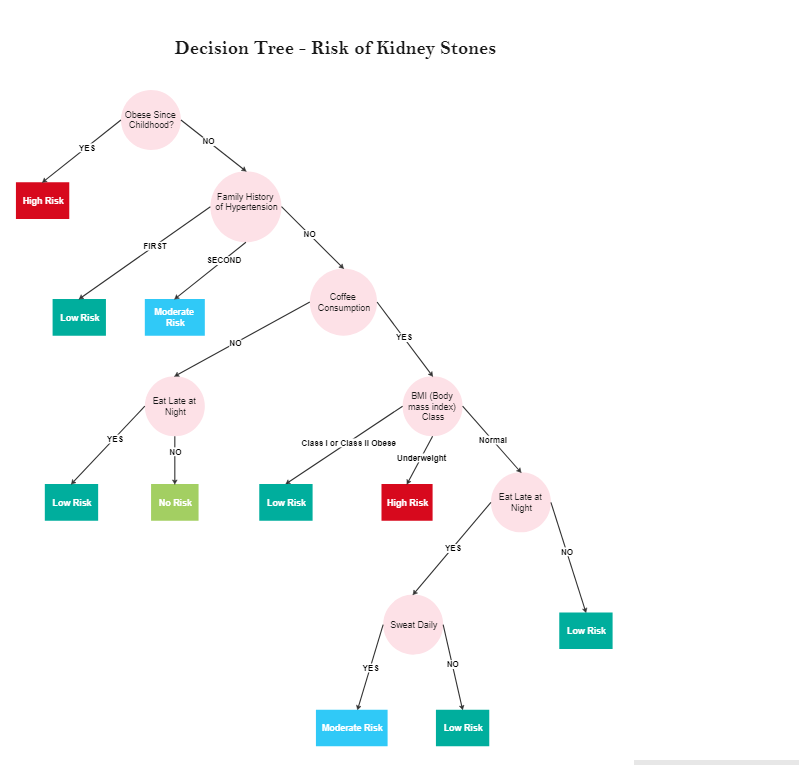
In this example, we can see a tree diagram to analyze the risks of kidney disease. The endnotes are low risk, high risk, and no risk. We check the subject on different conditions, and on answers, we decide if it is high risk or low risk.
We can see a gradual refinement of decisions based on the questions asked. For example, each circle depicts a question, and a square box shows an end node. First, we want to see if the subject has been obese since childhood. If yes, she is at high risk without evaluating any other condition. If this is not true, we see whether there is a family history of hypertension, coffee consumption, and BMI index, etc.
Example 2
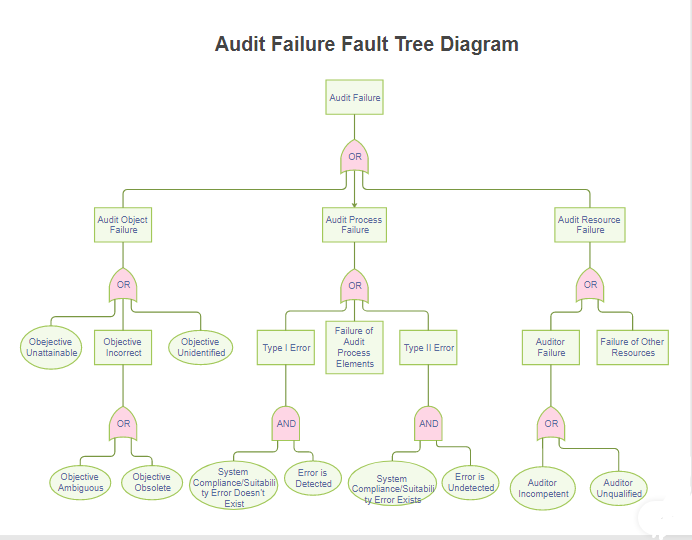
This example is a fault tree diagram to analyze the reasons for an audit failure. In this example, many causes are found to contribute to the system failure. This fault analysis is used in organizations in the failure events to analyze its possible reasons.
Part 9: Conclusion
Tree diagrams are essential to project management tools used in many different fields like project execution, risk analysis, decision trees, linguistics, and study probability in mathematics. It is a simple tool yet very effective to communicate the possible choices and results. However, it has the potential to become very complex when the number of levels increases manifold. In those cases, more compact tools are more efficient.

