Various Diagrams for Sales & Marketing
Here is a great technique to improve marketing and sales efficiency - applying visual tools. BCG Matrix, SWOT Analysis and charts and graphs (pie and bar charts etc.) are all amazing tools for professionals in market and sales field.
Businessmen and staff in this field need to do quite a lot of work to gain higher profit. The list of relevant work includes mainly making products catalogue, advertising, designing brochures, forms and flyers, make business cards and summarize sales work and so on. There are hundreds of methods to handle these things. Edraw is a versatile tool which can cover most needs in this area in a visual way.
Use BCG Matrix to Analyze Market
Deploy SWOT to Seize Opportunities and Minimize Threats
Apply Charts & Graphs in Sales Report
Use Business Card to Market Yourself and Your Organization
Create Attractive Flyers to Advertise Products
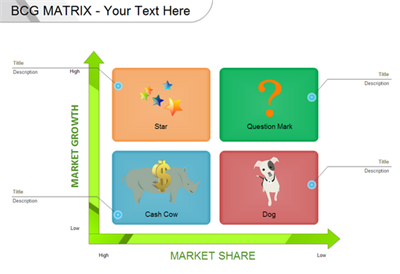
BCG Matrix is widely used in brand marketing, product and strategic management and portfolio analysis.
To reap bumper crop in business world, you got to find out where, when and how to plant your limited seeds - invest money. Let BCG Matrix helps you accomplish this visually and easily. Separate different kinds of markets obviously in this template. You can also notice your research to other staff in such an easy-to-understand way.
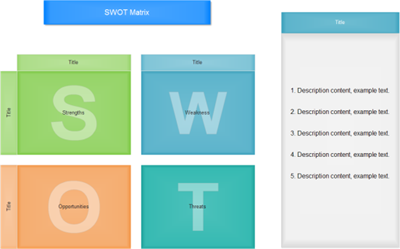
Completing a SWOT analysis will help you to determine the strategic fit between
an organization's internal, distinctive capabilities and external possibilities
and to prioritize actions.
It is well said that one's biggest enemy is himself. This also applies to business corporations. Sometimes, threats come from one's own shortcomings. Knowing the organization well is the first step to manage it well, including, but not limited to, strengths, weaknesses, opportunities and threats. SWOT analysis is the perfect solution for this goal. Chance only favors prepared minds. If you are always ready, you can seize more opportunities. Likewise, threats can be minimized by preparing well.
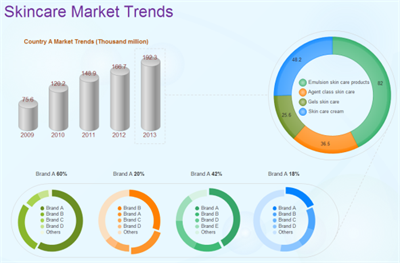
Statistics are the hard evidence for your sales and market situation. But if you only list them out without analyzing, they are still just meaningless numbers. You had better compare data in different periods, find out the trend, and dig out the relationship between digits and facts. Edraw Charts & Graphs maker can cover all the needs mentioned. These charts and graphs will play an important role in sales report. So it is really worth the efforts. Here are a few examples. Try it to check the effect yourself.
Market Analysis Report Template
Sales Comparison Chart Examples and Templates
Column Sales Report Chart TemplateNetworking is crucial for business success. Need an appropriate business card to market yourself and your company? Get it from Edraw. It will only take you 2-3 minutes because the main structure is pre-drawn. The templates cover a wide range of professions. You surely can find desired cards from it.
Business Card Template

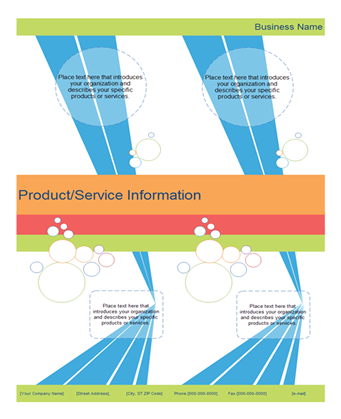
Though you strongly believe your products are high quality and wonderful, others may know nothing about them. And your competitors' flyers are flying everywhere. How can you stand out from so many rivals? Edraw offers you some support in advertising. It can generate creative flyers with over 6000 vector shapes.
More Visual Tools for Marketing

|
|
|
Market Research
|
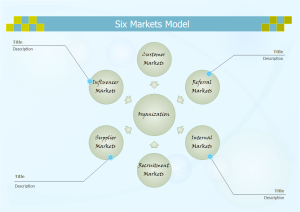
Six Market Model
|
|
|
|
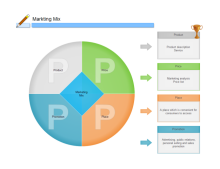
Marketing Mix
|
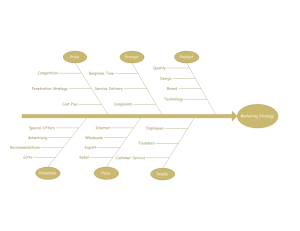
Marketing Strategy Fishbone
|
The above diagrams are all created by Edraw - an all-purpose diagramming tool. Equipped with predefined shapes and ready-made templates, users can generate professional-looking diagrams instantly. It will empower even beginners to gain visuals as easy as pie. You can download and try it for free for 30 days.
