Radar Chart Guide - Create Radar Charts for PowerPoint
Sample Presentation - Radar Chart Guide
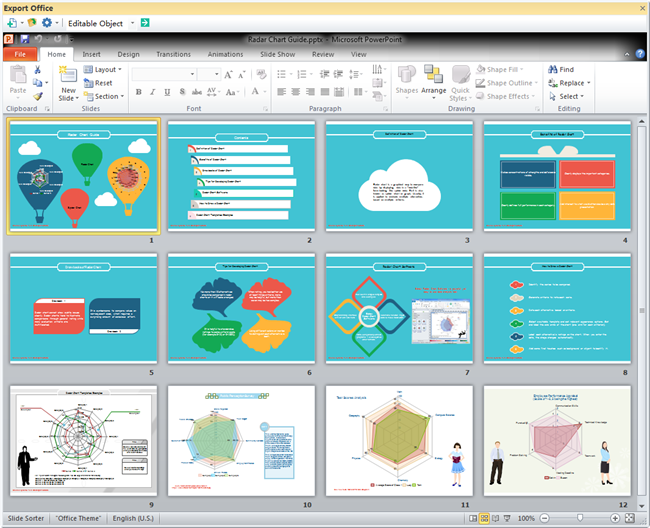
Here is an editable presentation example which explains radar chart visually. It presents a simple guide about radar chart from the following perspectives:
- Definition of Radar Chart
- Benefits of Radar Chart
- Drawbacks of Radar Chart
- Tips for Developing Radar Chart
- Radar Chart Software
- How to Draw a Radar Chart
Click the following image or links to download this PowerPoint example.
This slideshow example is free for download and easily editable. Double click the text boxes to replace the content. The shape size, color and background can all be edited easily.
You can also export the eddx file into PDF, JPG and many other formats. These creative slides will surely help you stand out from the crowd and help you create radar charts better.
To design more beautiful slides like those shown in the presentation, try our amazingly powerful presentation tool.
Free Download Diagramming Software and Create More Marvelous Presentation
Create Radar Charts in PowerPoint Format
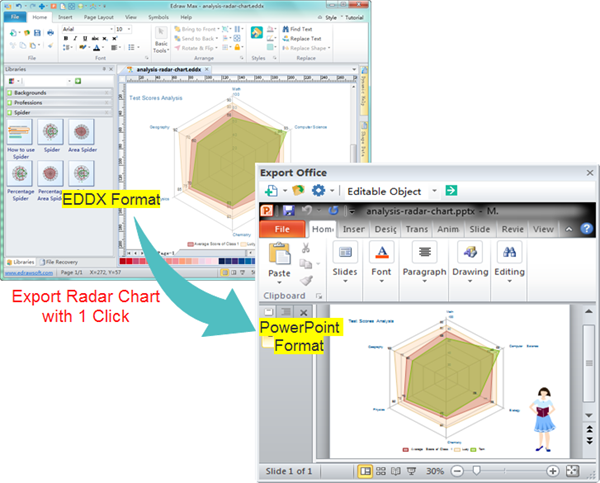
Try our out-of-the-box software to make your radar charts for PowerPoint a lot faster than MS Office. After the radar chart is finished, it can be turned into PowerPoint format with 1 click.

Here is a step-by-step tutorial showing you how to make radar chart in PowerPoint format.
- Start Edraw.
- Double click the icon of Radar Chart in Chart category.
- Drag a suitable spider shape onto the canvas.
- Edit the shape through the floating button.
- Resize the shapes by dragging the selection handles.
- Reset diagram style by choosing another theme.
- Double click the text boxes to type in texts.
To export the diagram as PowerPoint format, do either of the following.
- Click the export PowerPoint button in the Quick Access Toolbar on the upper left corner of the program. It is an orange button with a Capital P letter.
- Go to File tab, hit Export & Send, Choose Office and then Click PowerPoint.


