How to Track Project Progress Using Gantt Chart?
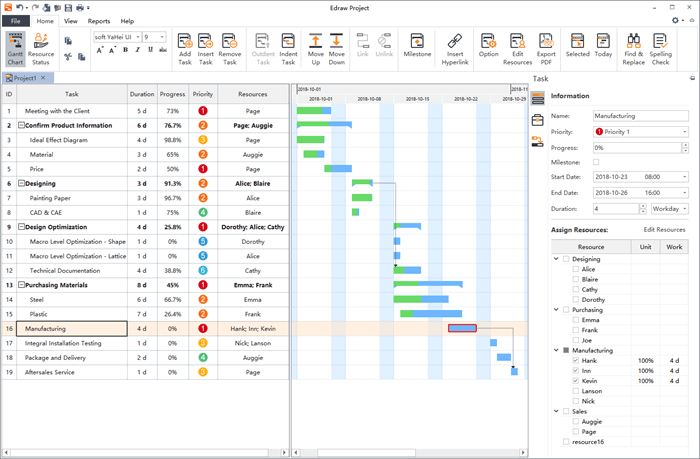
A Gantt chart is a bar chart that visualizes your project schedule. It consists of a vertical task list on the left and a horizontal timeline on the right to present the break down structure of the project work and the relationship between the tasks. As a project management tool, a Gantt chart can not only be used to plan a project but also track the progress of a project to know where the employees are in the process. Use Gantt chart to track project progress contributes a lot to efficient team communication, clear accountability and specific work instructions. How to track project progress using Gantt chart? The following points can give you a leg up.
Track Project Progress with - Milestones
In project management, milestones are specific reference points that mark major events or moments in a project timeline. Such events or moments can be kick-off, deadlines and reviews that indicate how a project is moving on. To manage project success and meet stakeholder expectations, milestones are used as major progress points. Real-time Gantt chart examples of using milestones in your project cloud be the release of a new application. A Milestone task does not have duration in the timeline, and it can be placed where there is a logical conclusion of a phase of work, or at deadlines imposed by the project plan. After you have set a task as a Milestone, you can see the Milestone appear as a small rhombus on the timeline in a Gantt chart.

Track Project Progress with - Task Dependencies
Dependencies in the Gantt chart show the relationship between tasks in project management to set up the tasks in sequential order. When a project is complex and contains many tasks that depend on the completion of others, it becomes difficult to manage and analyze the project. Task dependencies enable you to decide when a task can be started to implement complex projects efficiently. Common tasks dependencies are Finish to Start, Finish to Finish, Start to Start and Start to Finish. A task dependency is generated when you link two tasks together. Once the dependency is established, every single change you made to the predecessor task's schedule affects its linked successor task.

Track Project Progress with - Drag and Drop
After a task begins, you can track the task progress with a progress bar showing the completion percentage upon the task bar. Usually you can record the completion percentage manually using the mouse. With the drag and drop feature in a Gantt chart, you can update the progress of your tasks directly, and create links to present the logical relationship between them. Such interactive function enables you to make several changes in one place, or adjust a single task at a time.
In Edraw professional Gantt chart software, you can choose to use the Auto Progress function. If the Auto Progress option is checked, the progress bar will be updated automatically each day.

Track Project Progress with - Critical Path
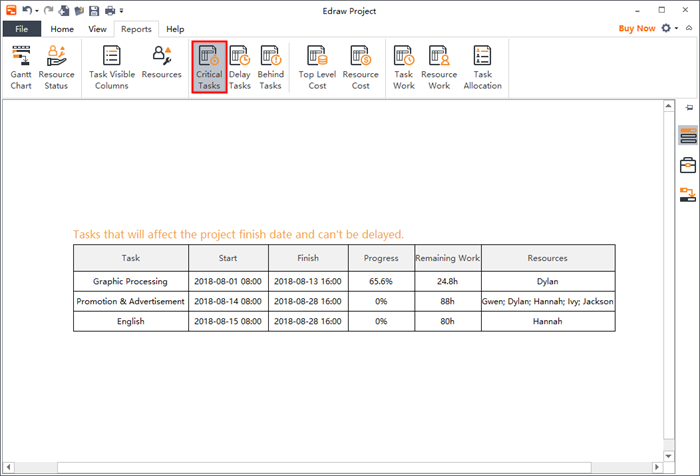
Gantt chart software as well as progress tracking software allows you to enable a critical path on your progress tracking template to see the shortest time in which a project can be completed. The combination of critical path with the Gantt chart reports help you aware the tasks to which you should pay attention. It has to be cleared that the work “Critical” does not mean that the task is complex or important or need to be closed, monitored, but the focus is on terms schedule that will affect the project finish date.

A Gantt chart is a valuable tool to have in your project management career. It offers flexibility, transparency, accountability, and makes your overall project more easy and convenient to manage. If you want to try using Gantt chart to track project progress, Edraw professional Gantt chart software would be a nice choice.

