Gantt Charts' Advantages and Disadvantages for Project Management
What Is a Gantt Chart?
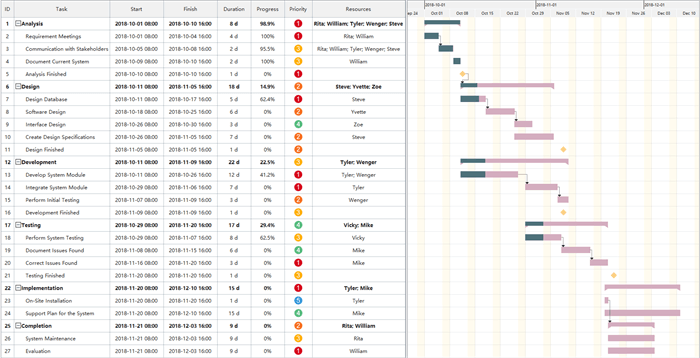
A Gantt chart is a project management tool which visualizes information and dependency of project tasks. Each bar on the timeline represents a task and displays the start and finish date as well as the progress intuitively. Combining the task table on the left and the timeline on the right, a Gantt chart shows detailed informmation of each task and the overall project, which benefits project managers in project scheduling.

Advantages of the Gantt chart
Make full use of the advantages of Gantt chart to improve understanding and communication between a project manager and the team members.
1. Visualize Project Information Clearly
Different from project plan documents made by Word, a Gantt chart shows essential information about a project and the tasks involved in a graph. Comparing with tedious words explanation, the cells and bars visualize the progress of each task at a glance, allowing the audience to see the start and finish date, duration, priority and resources allocation of a task at a glance.
Whenever you come to the Gantt chart, you can see the complete percentage of tasks and check the project status to keep up with the time. By visualizing all these elements, you can thus realize the feasibility of your schedule and make adjustments if necessary. If something unexpected happens, you are able to take appropriate action in time.

2. Improve Accountability and Communication Efficiency
As has mentioned above, a Gantt chart displays a clear visualization of a project and the tasks involved. Such visibility not only saves the project leader much time to explain a project to his team members, but also engages the team to follow the progress and prepare for the successor task at the right time.
Besides, planning a project with Gantt chart makes it easy for stakeholders to understand the timeline and get clarity of the project breakdown immediately, thus establishing their accountability. If everyone get clear about his role and partners in the project, then misunderstanding and budget overrun can be under control. It enables the team to better coordinate project activities thereby enabling the team to improve overall efficiency.
3. Make Project Planning Practical and Realistic
For most people, it is usually vague and ambiguous when they plan a project in mind. However, when you try to put your project plan into a Gantt chart which requires start and finish date in the calendar, duration, delay possibility, cost and resources allocation, you must quantify the information to make things clear. You will go deeper about the plan and consider more details that influence the priority and practicability.
To ensure the practicability and achievement of your project, realistic planning helps to avoid the delays and losses of money that may result. The process of putting a project plan into a Gantt chart forces you to think about your ideas carefully and give a practical and mature plan.
Disadvantages of the Gantt Chart
1. Time Consuming to Manage and Update a Gantt Chart
A Gantt chart consists of a task chart on the left and a timeline on the right. If the project is complex and involves many tasks in a work breakdown structure, then all tasks are not visible in a single view of a Gantt, so you need to scroll down to view more tasks. Besides, the task bars on the timeline represent only the time rather than the actual work hours and workload. Edraw Projects supports to update the progress automatically if the Auto Progress option is checked. However, if someone is absent, you need to record the completion percentage manually using the mouse. If you have ever used a Gantt chart to manage a project, you’ll find it not easy to re-align the tasks from on section to another.
2. Lack Collaborative Functions
For project managers, the Gantt chart does a good job in planning the basic information and calculates the real-time cost. However, for the team members whose job is to carry out the tasks, collaboration rather than planning matters a lot. If they need to manage the workload, share documents and communicate about the work, a Gantt chart would have limitations on visibility, coordination and clarity.
How to Create a Gantt Chart
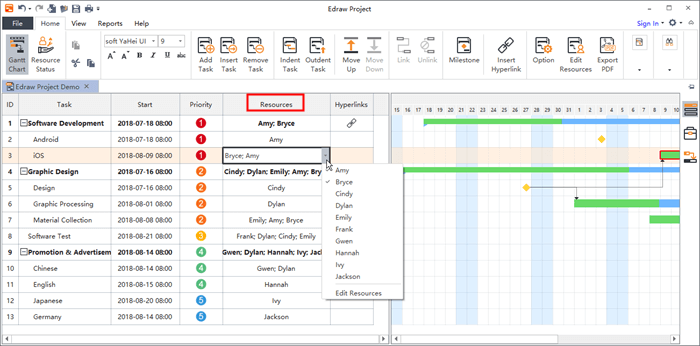
Professional Gantt chart software such as Edraw Project help project managers a lot in planning and managing a project by making a Gantt chart easily. To create a Gantt chart, the project manager needs to list all the tasks and divide them into proper breakdown sub-tasks, and then set available resources for each task. Setting project basic information such as the start and finish date, task priority and baseline cost is necessary to make every task practical. View more Gantt chart examples and balance the advantages and disadvantages of Gantt charts to see how they benefit project management.


