How to Create a Cross Functional Flowchart
Part 1: What is Cross Functional Flowchart?
Similar to a swimlane diagram, cross functional flowcharts separate a process by user, breaking down who is in charge of what function in a process.
Cross functional flowcharts can utilise both vertical and horizontal swimlanes at the same time, allowing for an increased breakdown of a process and thorough look at each person or team's responsibilities. For example, the vertical swimlanes can be the phases of a process, while the horizontal swimlanes can be the players in the process.
Like with swimlane diagrams, cross functional flowcharts can be used to identify redundant or problematic steps in a process, and clarify each team member's role.
Part 2: Who Can Benefit From Cross Functional Flowchart?
Similar to a swimlane diagram, cross functional flowcharts separate a process by user, breaking down who is in charge of what function in a process.
Cross functional flowcharts can utilise both vertical and horizontal swimlanes at the same time, allowing for an increased breakdown of a process and thorough look at each person or team's responsibilities. For example, the vertical swimlanes can be the phases of a process, while the horizontal swimlanes can be the players in the process.
Like with swimlane diagrams, cross functional flowcharts can be used to identify redundant or problematic steps in a process, and clarify each team member's role.
Part 3: How to Make Cross Functional Flowchart?
Step 1: Start EdrawMax.
Step 2: Navigate to [New]>[Flowchart]>[Cross Functional Vertical] or [Cross Functional Horizontal].
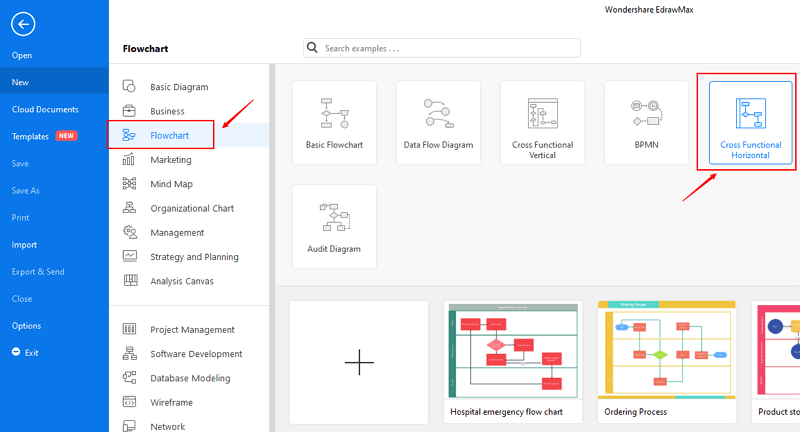
Step 3: Select one cross functional flowchart template to edit on it or click the [+] sign to start from scratch.
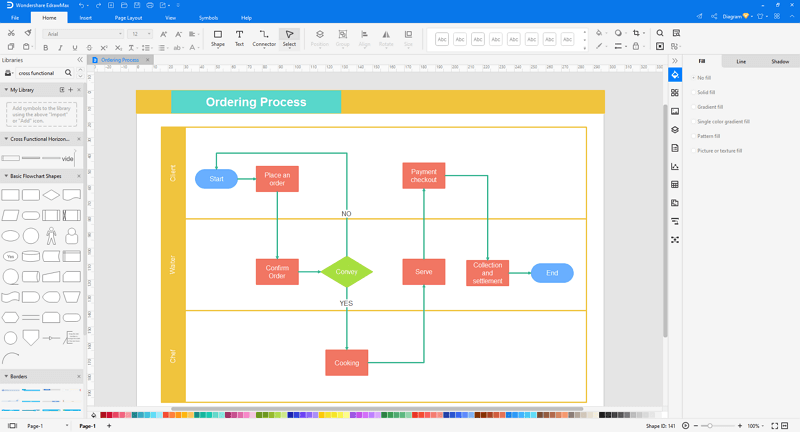
1. Define the scope of the process, find out the start and the end point, and mark it with a clearly defined output or event.
2. Usually you need to recognize activities, important outputs, and latency time in your process from the end to the beginning. For a new process, we strongly recommend you to start identifying from the end. But for the reconstruction of an existing process, we normally start recognizing from the beginning.
3. Find out departments that are responsible for each activity in the process.
4. Divide the chart into swim lanes, one swim lane represent a department. Departments which have close relationships can be put together.
5. Start to track from the end to the beginning, put the sub-contents in sequence, and place them in each department they belong to respectively at the same time.
Step 4: You can export the file to Graphics, PDF, editable MS Office file, SVG and Visio vsdx file.

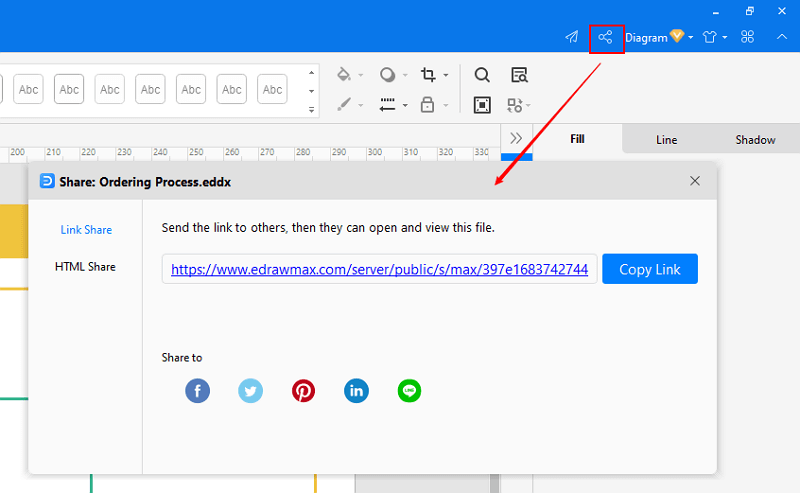
Step 5: And you can share your diagram with others via social media and web page.
Watch this video to learn more. If the video doesn't play, please visit it at YouTube.
If you have trouble in watching the video tutorial, please visit it at YouTube.
Part 4: Cross Functional Flowchart Examples
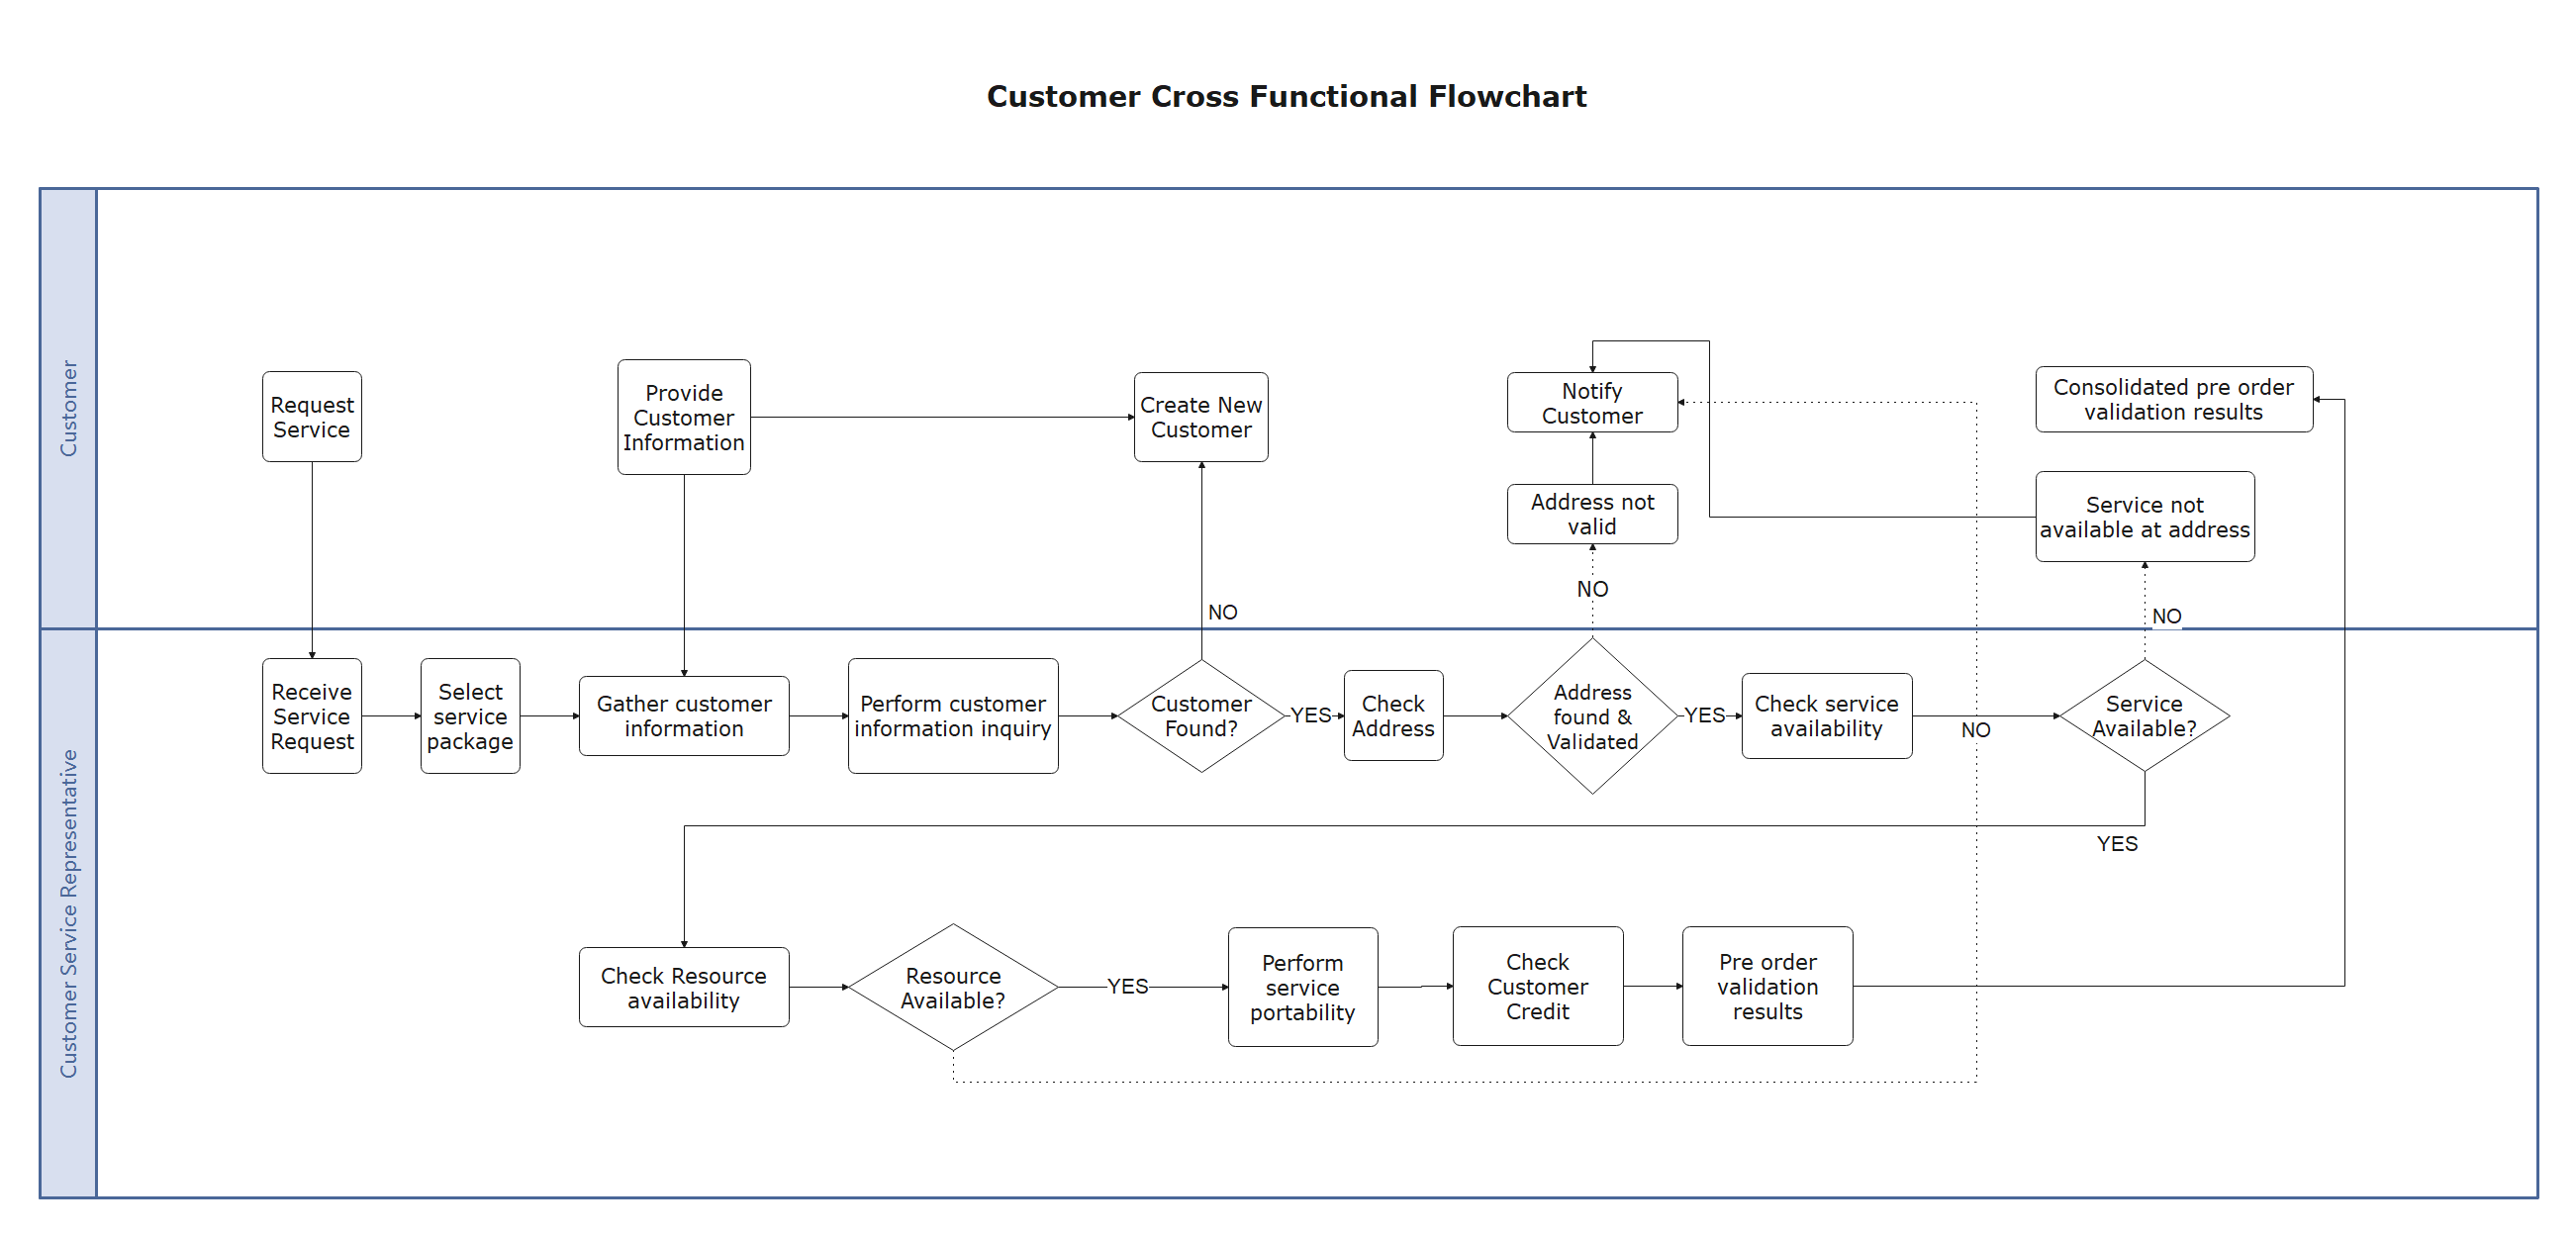
Example 1: Customer Cross-Functional Flowchart
The customer service process begins when a company receives the first contact from a user until the said department resolves the problem. The user’s problem can go from one step to another, depending upon the situation’s gravity.
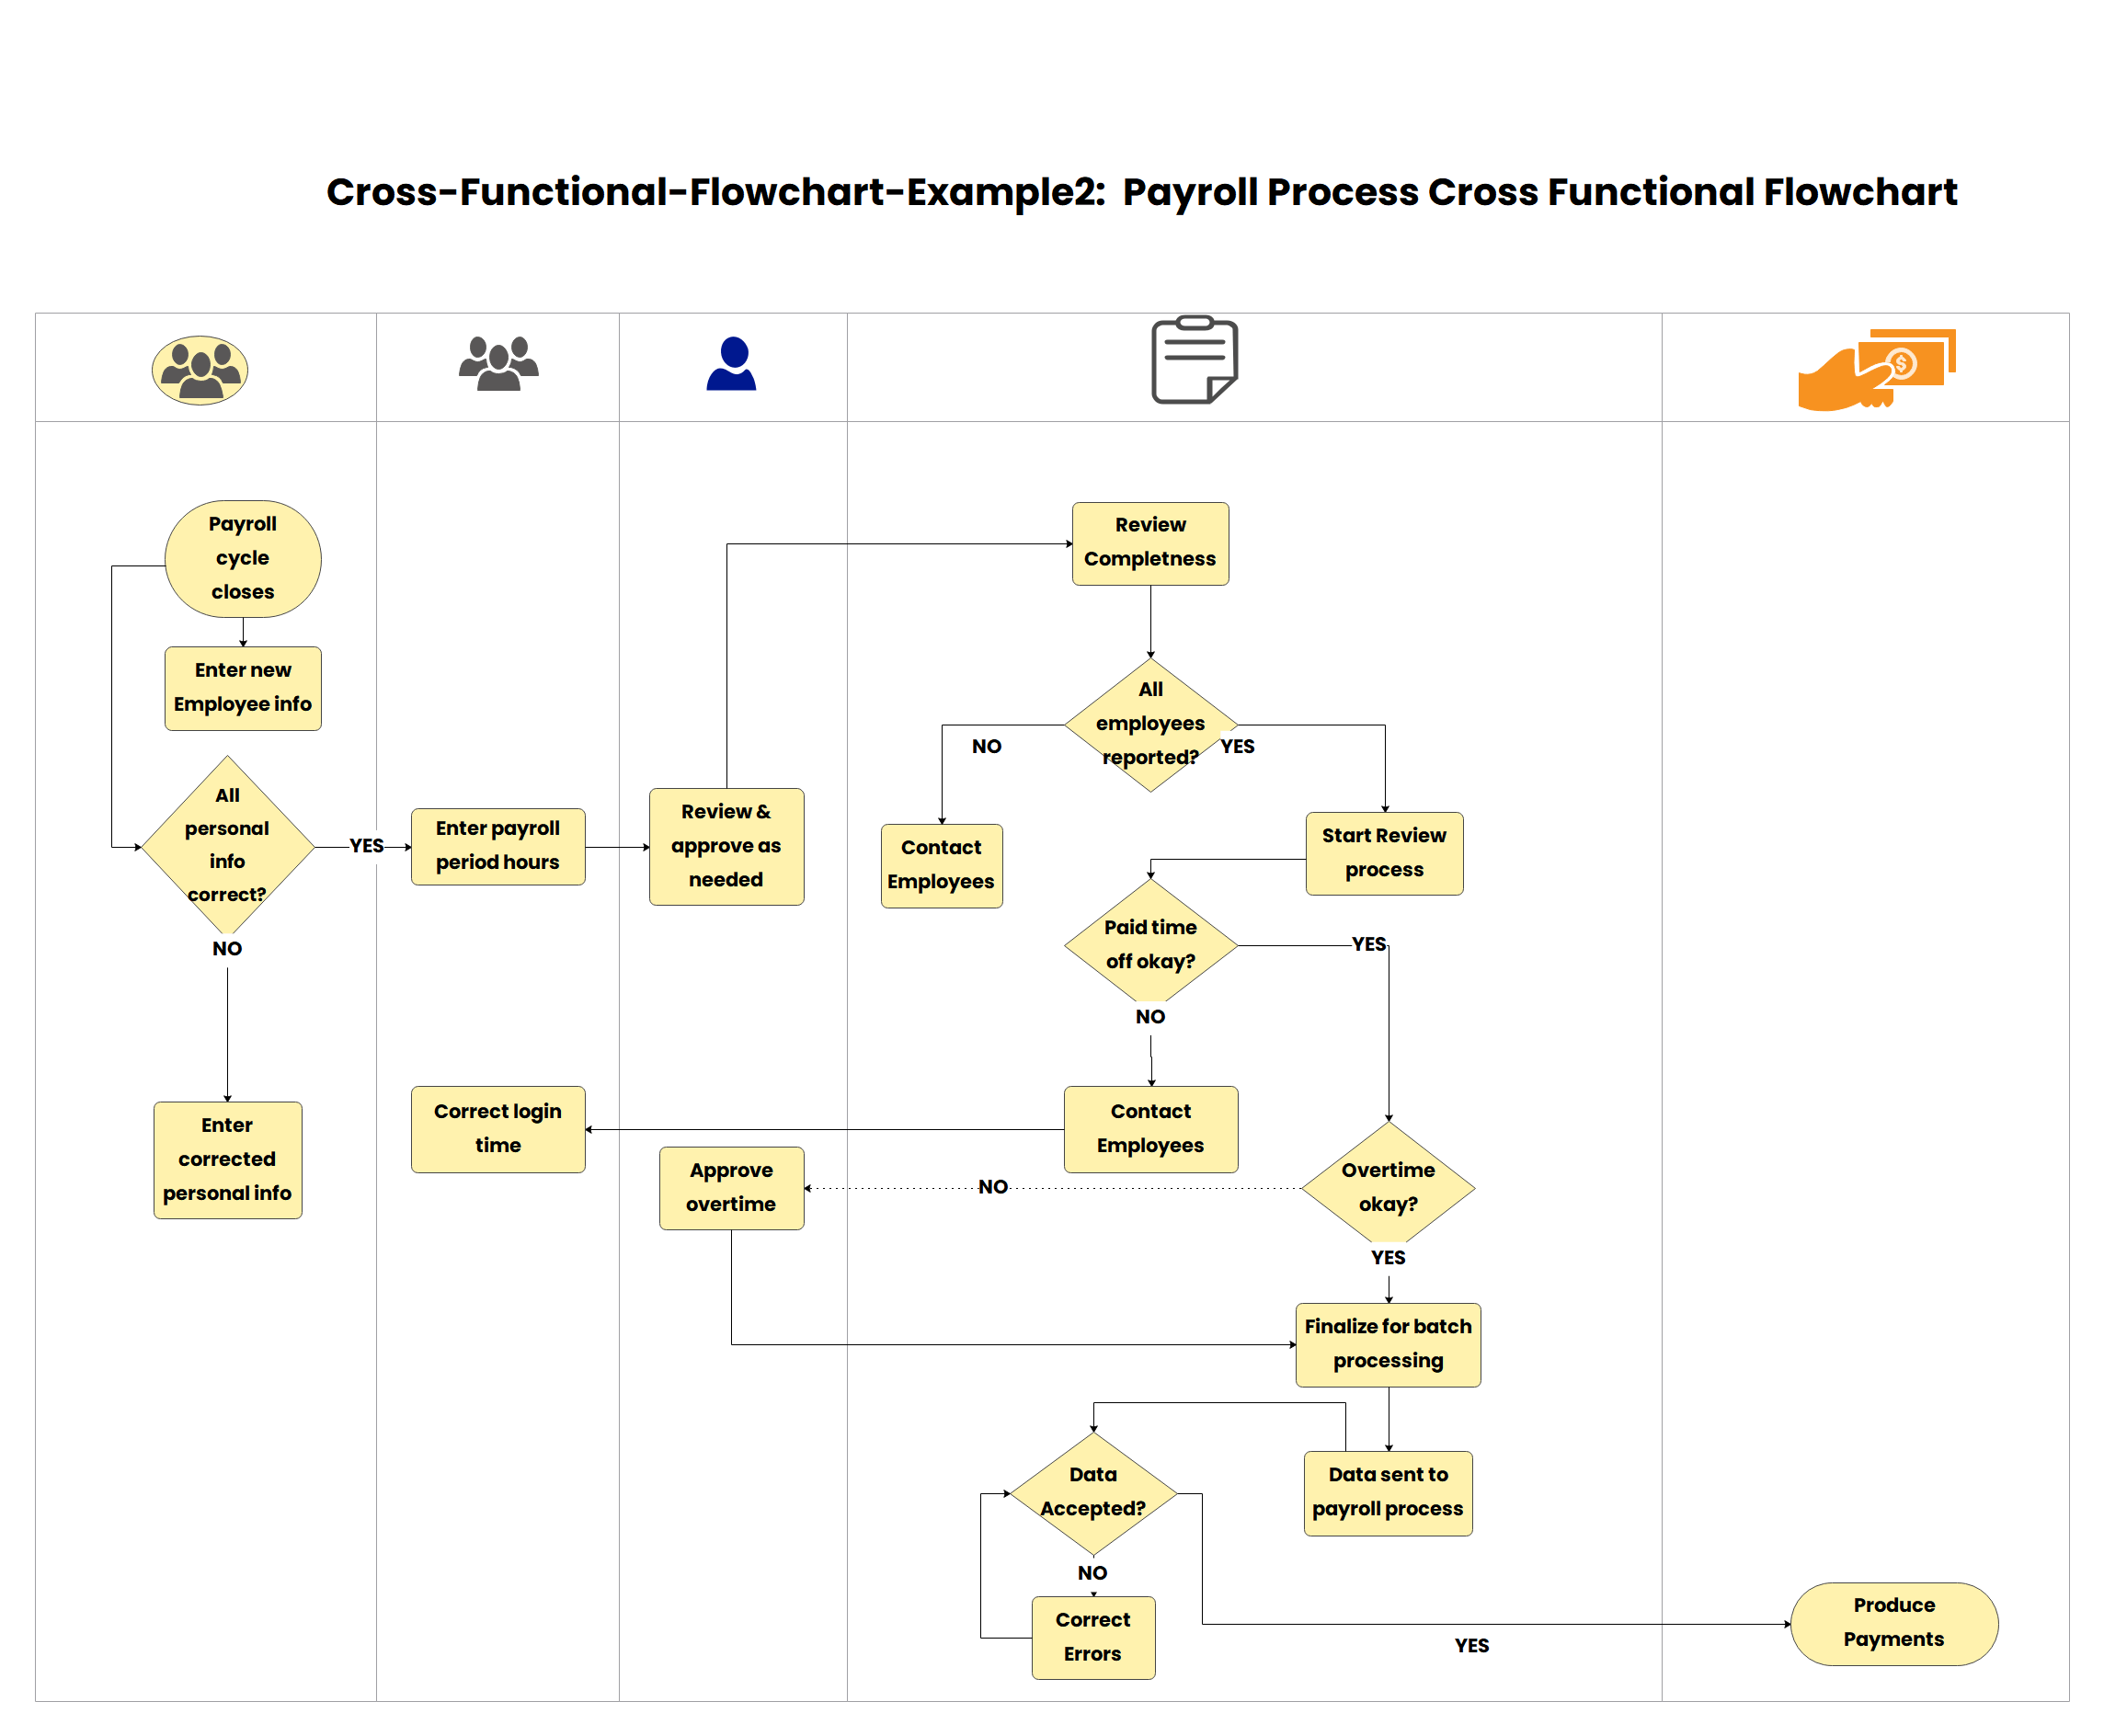
Example 2: Payroll Process Cross-Functional Flowchart
Payroll defines the total of all compensation a business must pay to its employees for a set period of time or on a given date. Developing organization pay policy, including 401K, LTA, HRA, and others.
