Linux Line Chart Software - Design Line Charts without Any Effort
Line Chart Software for Linux - Introduction
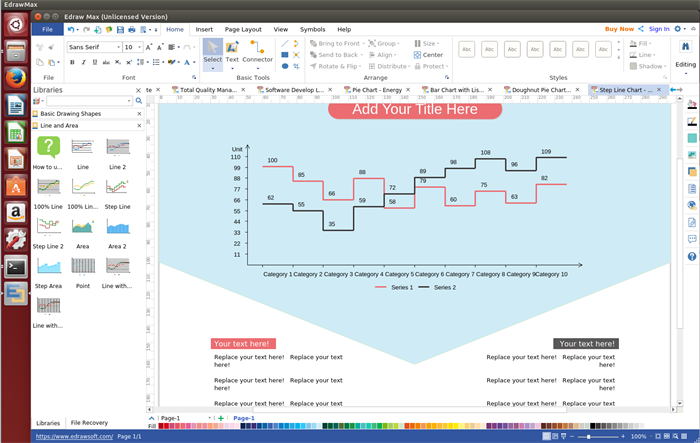
Edraw Line Chart Software for Linux is one of the best line chart drawing tools that comes with a lot of free and editable templates. Users can design their own awesome line charts quickly. Furthermore, its built-in vector symbols greatly enhance your productivity.
Free Download This Line Chart Tool and Create Line Charts on Linux:
System Requirements
Compatible with Linux system including Debian, Ubuntu, Fedora, CentOS, OpenSUSE, Mint, Knoppix, RedHat, Gentoo and More.
Top Features of This Linux Line Chart Software
- Various free templates and examples are available in this software.
- Visual and effective display of data series.
- Automatic changes of the line point position according to the modified rate of its point value and axis max value.
- Supports to add description to any shape or line.
- A set of nice-looking themes with advanced effects. You are allowed to change the whole diagram by changing the active theme in one click.
- You can export the line chart to pdf, ppt, html, word, excel, and many other graphic formats such as jpg, png, etc.
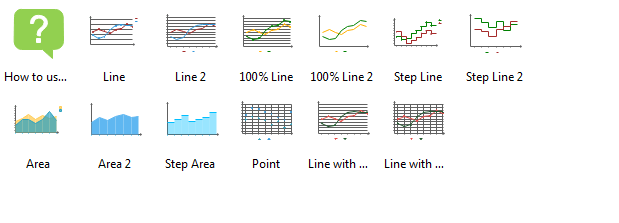
Line Chart Symbols
This program offers you pre-made line chart symbols like line, 100% line, step line, area, step area, point, etc to help create line charts accurately.
Simple Steps to Create A Line Chart on Linux
Following are some basic steps to create a line chart on Linux:
- Open a line chart drawing page. Navigate to"File" menu > "Chart". Double click "Line" to open a blanking drawing page or you can select an existing example to get started quickly.
- Add line chart shapes. Drag and drop shapes from the left libraries to the drawing page.
- Edit line chart data. Double click the value text above line point to edit the chart data, the line point position changes according to the rate of its point value and axis max value.
- Save or export the line chart. Click "Save" on "File" tab to save the line chart as the default eddx format, or choose "Save as" on "File tab" to save as other formats such as jpg, png, pdf, etc.
Learn detailed guide: how to create a line chart.
Line Chart Examples
Nice-looking line chart examples as below are created by our Linux line chart drawing software. Simply free download, edit, share even print them.
Key Event Line Chart Example

Comparison Line Chart Example

Related Articles
Linux Certificate Software - Make Professional Certificates Quickly
Concept Map Software for Linux - Make Professional Concept Maps Effectively
Linux Bar Chart Software - Draw Your Own Bar Charts As You Desire
Easy Linux Comparison Chart Software - Start from Free Templates and Symbols

