Free Line Graph Templates for Word, PowerPoint, PDF
Edraw is used as a line graph software encompassing built-in line chart symbols and ready-made line graph templates that make it easy for anyone to create beautiful line graphs. The line graph templates are easy to use and free. Edraw can also convert all these templates into PowerPoint, PDF or Word templates. We've created a video tutorial to help you get started with Line Chart: Video Tutorial - How to Create a Line Chart
Download our Free Line Graph Templates in Software Package to Use However You Like
Edraw Line Graph Template

Start From Free Edraw Line Graph Template
You can begin to create a line graph diagram by choosing a template.
Free Download Line Graph Template
If you want to use a ready-made template, go to line graph templates page and choose the Line Graph that best suits you.
PowerPoint Line Graph Template
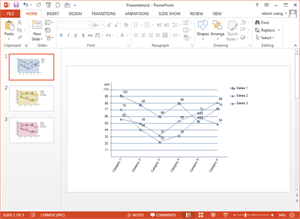
Easy to Create Line Graph in PowerPoint
When you finish creating your line graph in Edraw, one click on the Export button will transfer your drawing into MS PowerPoint presentation.
You need to consider few things when creating a line graph.
Word Line Graph Template
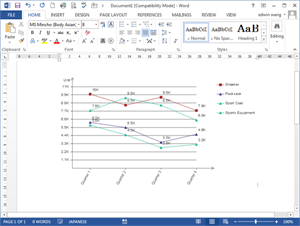
Personalize Your Line Graph and Give it the Look and Feel that You Want
In order to save the template as a design template, you need to download Edraw and edit it. All templates in the software gallery windows can be freely changed in color, theme and effect.
PDF Line Graph Template
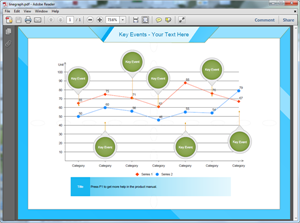
Create Line Graph for PDF
All are simple, only by clicking on the Export PDF button will convert your line graph template into PDF.
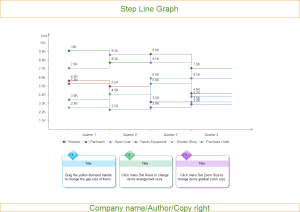
Step Line Graph Template
A step line graph template is often used to plot changes in data over time, such as monthly temperature changes or daily changes in stock market prices.
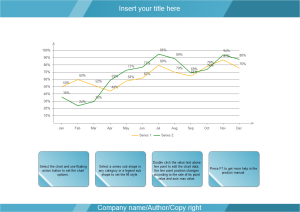
Line Comparison Graph Chart Template
A line comparison graph chart template makes it easy to read, digest and compare trends. Comparing the features and benefits of our small business lines of credit and loans. Scatter chart is similar line graph to determine the relationship between two continuous variables and to discover whether two continuous variables are correlated.
