Improve Lab Reports via Laboratory Equipment Shapes
Introduction
After months and even years of hard work, there still one more important step for your research - to report the result. Here are some practical tips on writing good lab reports. A group of specialized shapes are offered to add more persuasion into your report through information visualization.
Laboratory Equipment Shapes for Visual Lab Reports
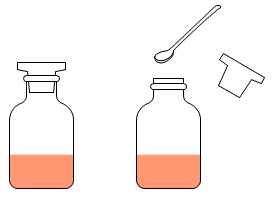
Edraw's laboratory equipment shapes are ready-to-use in popular vector format. It can benefit a large group of people including students, teachers, staff from chemical industry and researchers. Check out the shapes in the picture below. Refer to Chemical Laboratory Equipment Shapes for more details.
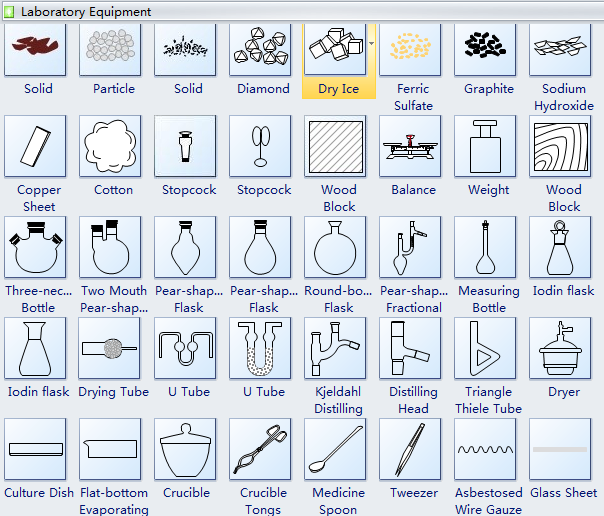
Free Download Software and View All Vector Symbols
Features of Laboratory Equipment Shapes
Readily Available
The shapes are already placed in built-in libraries next to the canvas. Using them requires drag and drop or copy/paste only. No download is needed.
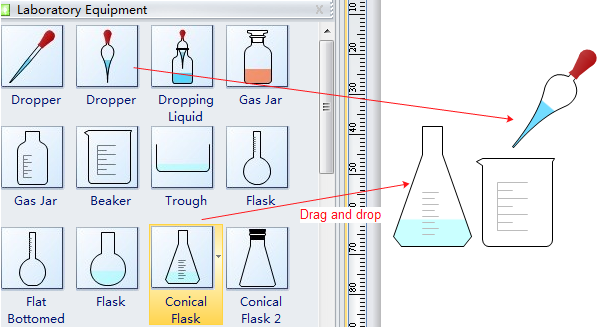
Easily Editable
You can select the shape, then click the action button to edit shape.
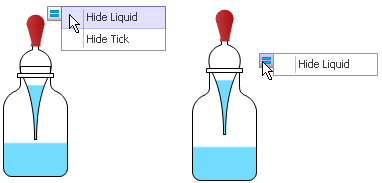
Flexibly Scalable
The clip art is in vector format. You are able to scale to size between 10% and 400% without loss of the display resolution. No blurred images anymore.

Color Changeable
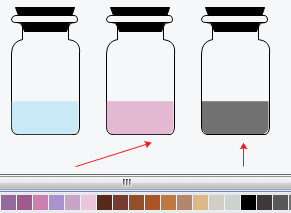
You are able to freely change filling colors and lines to fit your slide theme.
It's easy to change the color scheme for these clip art either through the color bar or themes, at 1 click. Every clipart was drawn with Edraw Software. So you can also choose the sub-element in the clip art to recolor it.
Separable
You are able to pull out drawing components to create your own illustrations.
Easy-to-use Laboratory Equipment Software
Edraw is a drawing package that allows you to draw chemical structures in minutes with an improved and user-friendly interface based on the feedback from years of experience. More information about this software can be found in Chemistry Laboratory Equipment Drawing Software.
Tips on Writing Lab Reports
1. The first and best advice is to keep your focus and make your R&D concise but informative. In particular, stick to the points that are relevant to the current experiment.
2.In the Introduction, clearly state what your hypothesis and predictions are. Don't just describe previous research and then assume the reader (i.e., the Professor or TA) will implicitly make the leap to what you're testing in the CogLab experiment.
3. Make sure there is a logical flow throughout, both between and within. Use TOPIC SENTENCES!! A topic sentence is the first sentence of a paragraph that provides a guide or roadmap for the entire paragraph. With a good topic sentence, the reader knows what the paragraph is about in advance and is primed to read what you have written.
4. When reporting statistics, for purposes of these lab reports anyway, two decimal places are fine. At the very least, be consistent across conditions.
5. Use some visual tools to analyze your statistics or present your research results in an organized and clear way:
- When using graphs or charts, make sure you label both the Y and X axis. Also, every figure must have a figure caption, at the bottom, that explains very briefly what the figure is about. Check out some examples made by Edraw chart software.
- As for tables, note that each table starts with a table legend that briefly says what the table is about.
- You can also draw some experiment diagram to show your research process visually. Just rely on Edraw to do this easily and quickly.
6. It is necessary to remember that you should use abbreviations sparingly and consistently throughout your paper. Define all abbreviations in the appendix - it is not necessary to re-define abbreviations in every new section.
7. Spell-check and proofread!!!
More Drawing Shapes
Laboratory Equipment Diagram Software
Chemistry Laboratory Instruments


