How to Do Infographic Research
The research determines the direction of the infographic and shows how it will be displayed to the audience. Research is essential to an infographic. The idea of an infogranphic can only be properly conveyed with abundant data and solid arguments. However, the research stage is very difficult to manage. This article will introduce you the basic steps of how to conduct research before you start designing the infographic.
How to Collect Data and Information for Infographic Research
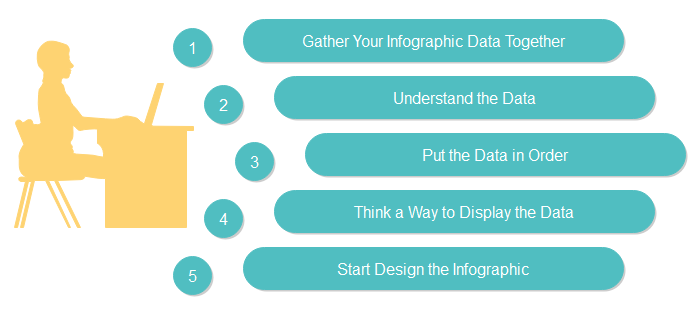
When you collect data, keep the following rules in mind :
- Make sure that you collect information comes from reputable, original and authoritative sources. For example, Websites as .govs, .edus, and .orgs are great resources.
- Find information related to the topic of your infographic and can help your audience to understand the message you are trying to convey.
- Be aware of the time of the data. Because it could be updated and that makes your data invalid.
- Know about the authors that you collect the information from. And ask yourself questions like: Is their information strong enough to support the topic of your infographic? Can you convince your audience with this information?
The research is the key to an infographic. An infographic is all based on the information you collected. So you have to ensure its validity and authenticity. You have to be absolutely certain that what you put into your infographic are true.
Organize Your Research
Once you have collected everything you need, put the data together and start to design your infographic. You can lay out all the information you collected and try to organize them according to the order they will be displayed in the infographic. And remember do not throw away the data not used, because you might need them for reference in case your audience raises questions.
When you are organizing the information you collected, you need to know what needs to be designed in the infographic. Therefore you need to know your data very well. In the process you will learn what to say, how to say it and when to say it while presenting your infographic.
Get Feedback
This is the final part of the research stage. Before you put the information collected into your infographic, ask your team partner or colleagues to review for you first. They might give you some advises from a different angle.
Once you received enough feedback from them, you might have to delete some of the data you collected. The mission of the data is to serve the aim of your infographic. If they fail to do that, you might as well be deleted.
Conclusion
In general, valid data and abundant information are the foundation of an infographic, so it is worthy making efforts and spending time.
Once you know how to research for an infographic, then you are ready to create your own infographic. If you think you have completed the research stage and that you are ready to design your infographic, you can refer to the Infographic Layout Guide and Infographic Design Tips to help you.
More Information Please See:

