Vector Infographic Chart Elements
We use charts to visualize complicated data in infographics and make them more informative and easy to understand. Therefore, chart elements are probably the most asked-for items during the infographic design process. Do you get chart elements from the “vector graphics download websites” or do you draw them on your own?
Let’s say, both of them are time-consuming. Why?
From those vector graphic download websites, you have a lot of choices with beautiful charts element packages. However, they are all static with certain values on, which have very few coincidence that the value is adoptable. So you still need to re-design them. If you draw them on your own, for example, using Adobe Illustrator, you also have to re-draw the chart each time when the value changes. And the process is quite difficult and tedious.
Now our infographic chart elements give you a new way to use and customize them to the way you like.
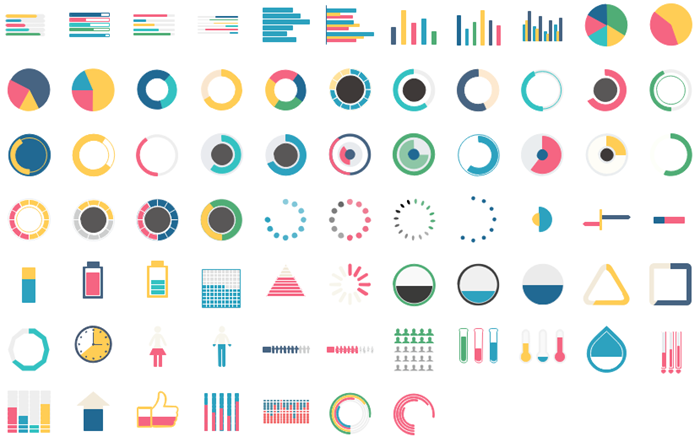
Infographic Chart Elements
We designed a collection of the most popular infographic charts, and equipped them with "quick control handles", so that the chart value can be easily changable. Below are the original charts you can start with, including bar chart, pie chart, circle chart, etc. In the next paragraph, let's learn how amazingly easy to change the chart value.
Get all infographic chart elements from our offline infographic software:
Set Infographic Chart Value
Changing infographic chart value requires simple mouse dragging which you can finish in less than 1 second. Select the chart, you will see a tiny yellow control point. Drag this control point back or force, then both the progress bar and the value will change accordingly.
Change the Chart Color
You can change the chart color freely to fit your infographic color scheme. Select the chart, choose a color from the quick color bar. You can also use Fill and Line button for more options. To change a sub shape, click one more time to select it, then duplicate the above steps.
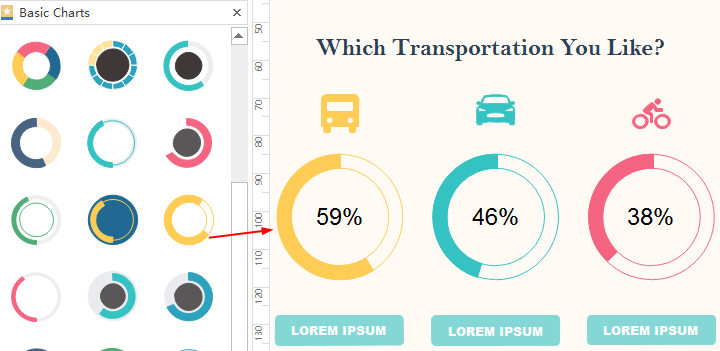
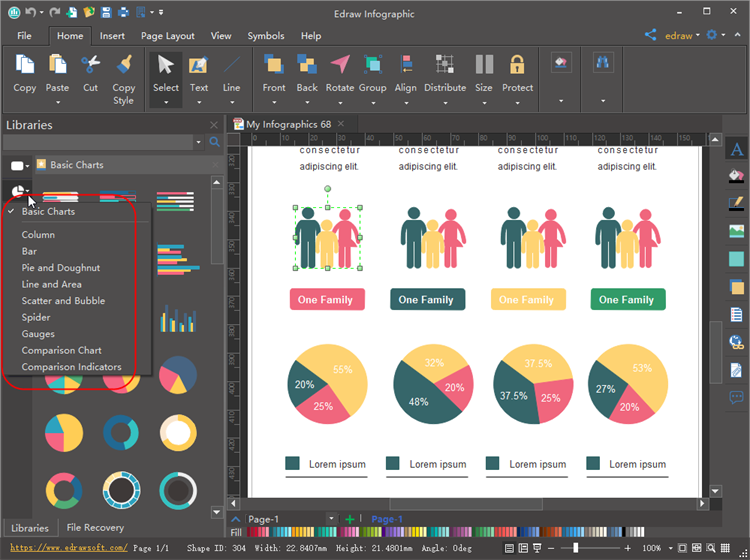
It's Super Easy to Use the Charts to Design Infographics
The following picture shows how you use the chart elements to design infographics. All the elements are in the "Basic Chart" library. You can choose any of them, and drag out on to the canvas. The editable chart elements allow you to change the chart value, size and color with simple mouse clicks.
There are More Chart Types in the Program
Other than the basic chart package, we also have other charts such as line chart, area chart, scatter chart, bubble chart, spider chart, etc. These charts are also easy to use.
View Video - Easily Editable Infographic Chart
More Articles:

