Easiest Way to Design Science Infographics
Best Software to Design Science Infographcis
Thanks to Edraw Science Infographic Design Software, you are able to create all kinds of infographics including fashion, transportation, music, flowchart, resumes, timeline infographics, etc easily and quickly with its built-in templates and examples.

Free download this easy-to-use Infographics Software to have a try:
Simple Steps to Design Science Infographics
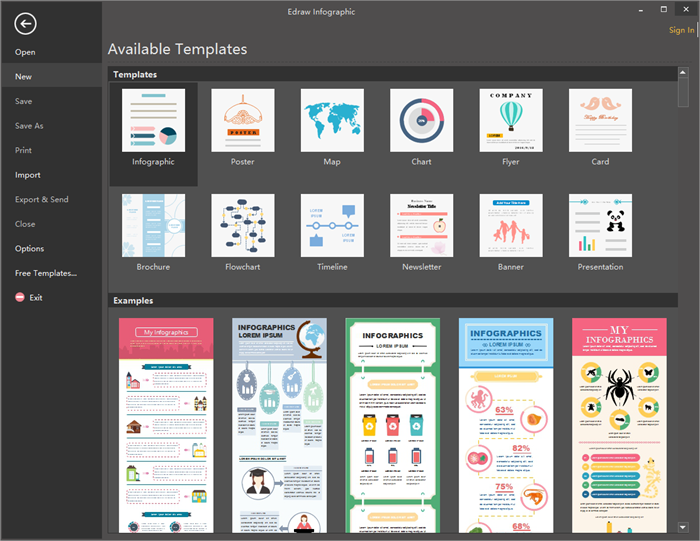
Step 1. Launch this Science Infographics Design Software, navigate to File menu > New > double click Infographic to open a blank science infographics drawing page.

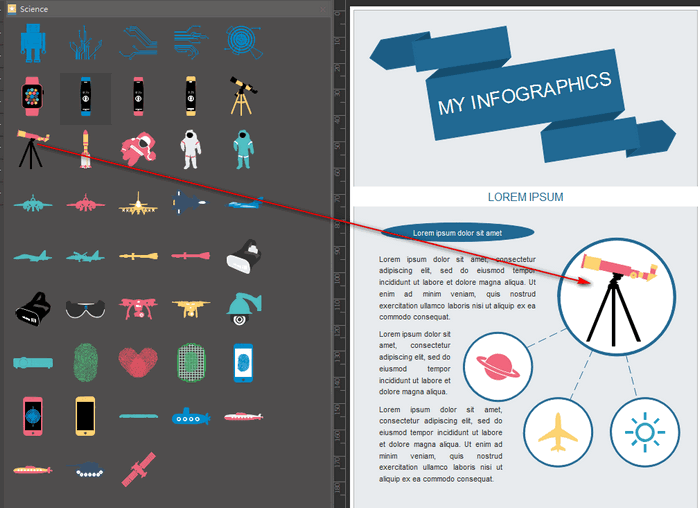
Step 2. Drag and drop science shapes from left libraries to the drawing page. You can also edit the symbols if necessary, such as changing the color, dimensions and directions.

Tips: you can also customize your own science elements with its embeded drawing tools.
Step 3. Go to Home page and click Text to add key contents or press ctrl+2 directly, then finishing typing by clicking any blank area or clicking Select under Home page.
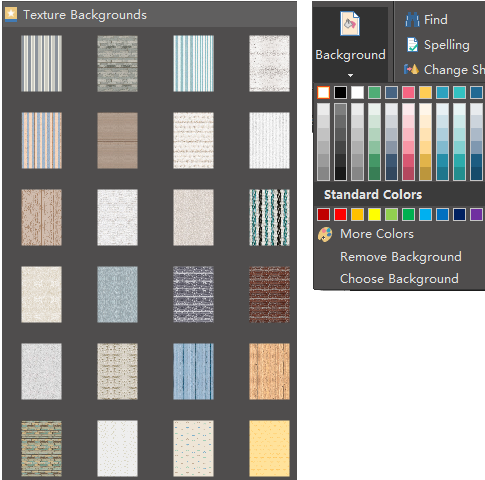
Step 4. Go back to left libraries again and select a texture background or simply click background under Home page to choose a single color background.

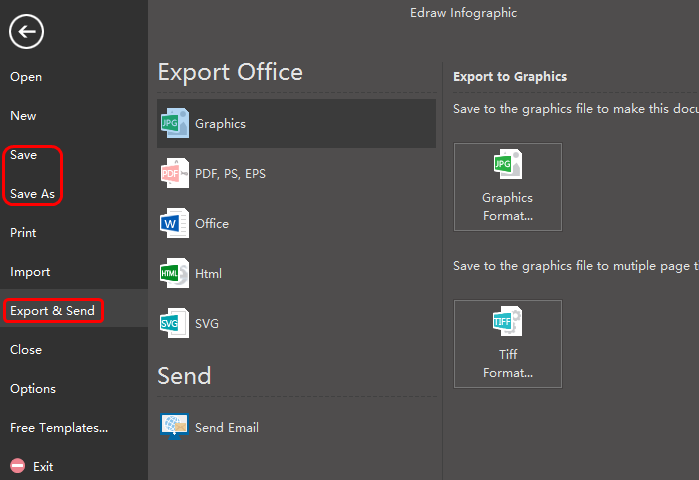
Step 5. you can click Save on File tab to save the fashion infographics as the default .eddx format; or choose Export & Send to export the infographcis to any other formats such as Word, Excel, HTML, PPT, or Visio.

Science Infographics Example
Here is an overview of science infographics created by Edraw infographics software, you can free download, edit, print and share it!

Related Articles
How to Design Animal Infographics
How to Design Flowchart Infographics

