Create Infographic Easily on Mac
Open an Infographic Template
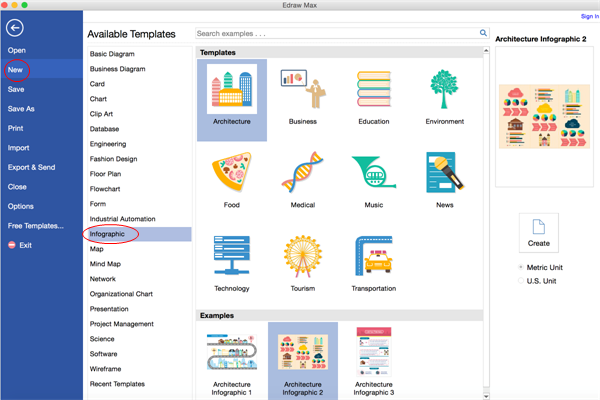
Open a blank canvas and the libraries including shapes needed for creating Infographics on Max OS X.
On the File menu, point to New.-> Click Infographic, choose an infographic type and then double click its icon.
Add Infographic Shapes
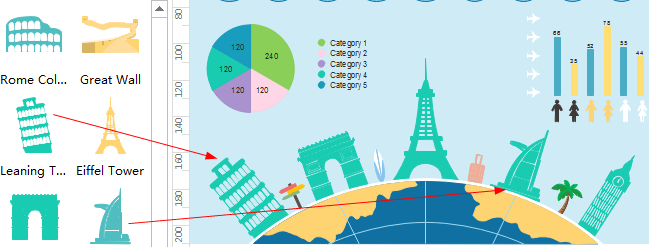
- From the left library, drag and drop suitable shapes to the canvas.
- Drag the green square handles to resize shapes and drag the round handle to rotate shapes.
Add Infographic Contents
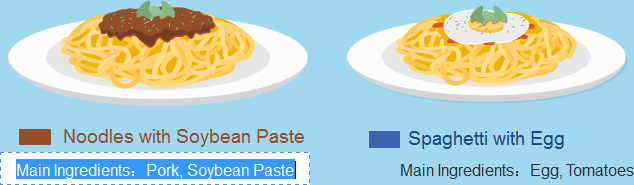
- Press Ctrl + 2 to add more text boxes. Press Ctrl + shift + 2 to adjust text box.
- Choose a different font under Home tab. Customize the size, color and alignment by clicking the relevant menus.
- Click the arrow under Font Color for Paragraph settings.
Edit Inforgraphic Charts
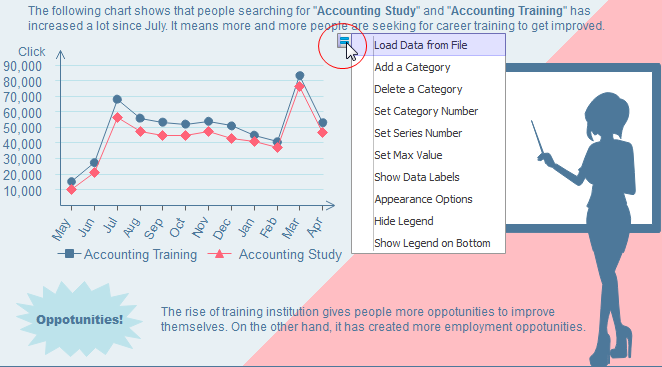
Some infograpic charts are smart shapes. Rest your cursor over the smart chart to show the floating action button.
Add/delete a category/serie by clicking relavant menues. Double click the data label to enter your own data.
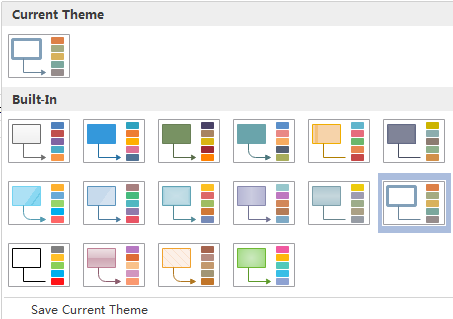
Change Infographic Theme
By changing Infographic theme, you can enhance fill, line and text style at 1 click.
Switch to Infographic tab, apply another Infographic theme. This operation doesn't apply to shapes that use standard colors.
Insert Pictures into Infographic
To insert your own pictures in local file, go to Insert tab and then choose Insert Picture From File.
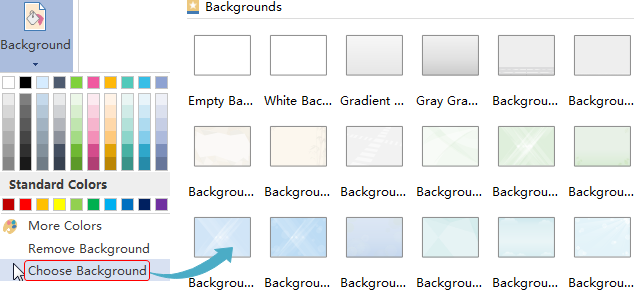
Add Background to Infographic
To add a background, go to Page Layout tab and then:
- Click a color for colorful background.
- Click Choose Background to select a predefined background.
- Click Remove Background if you don't want any background.
- Switch to View tab and then click Background View to edit and personalize the background.
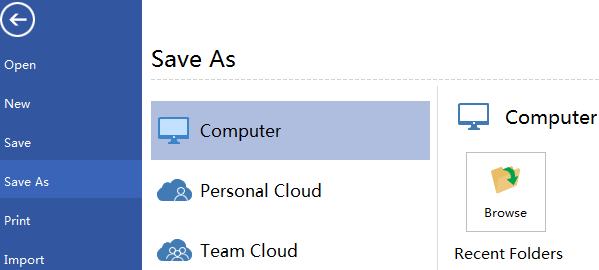
Save or Export Infographic
Click Save on File tab to save as the default format. Choose Save as on File tab to save as other formats.
You can choose to save in local files or save in your Cloud.
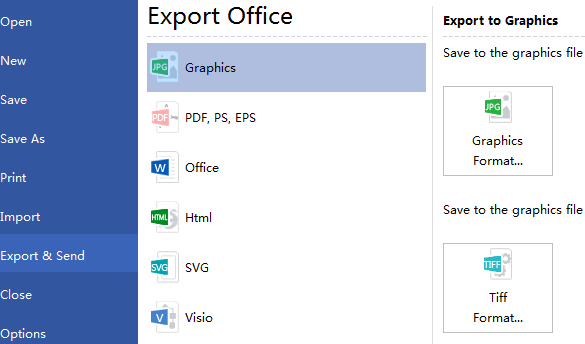
Hit Export & Send under File to export the infographics as images, presentation slides and web documents and so on.
Print Infographic
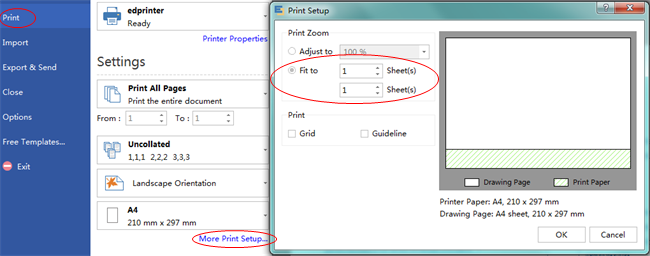
Click File tab and then choose Print to enter print setting and preview window. You can specify the print range and copies here.
If the drawing page is larger than the print paper, the drawing will be printed on more than 1 paper.
To print it on only 1 paper,
click More Print Setup... and then choose Fit to.
A list of Infographic Examples
Vector Infographic Design Elements
How to Create SEO-friendly Infographics
How to Do Infographic Research
Download Infographics Software