How to Create A Funnel Chart
Part 1: What is The Funnel Chart?
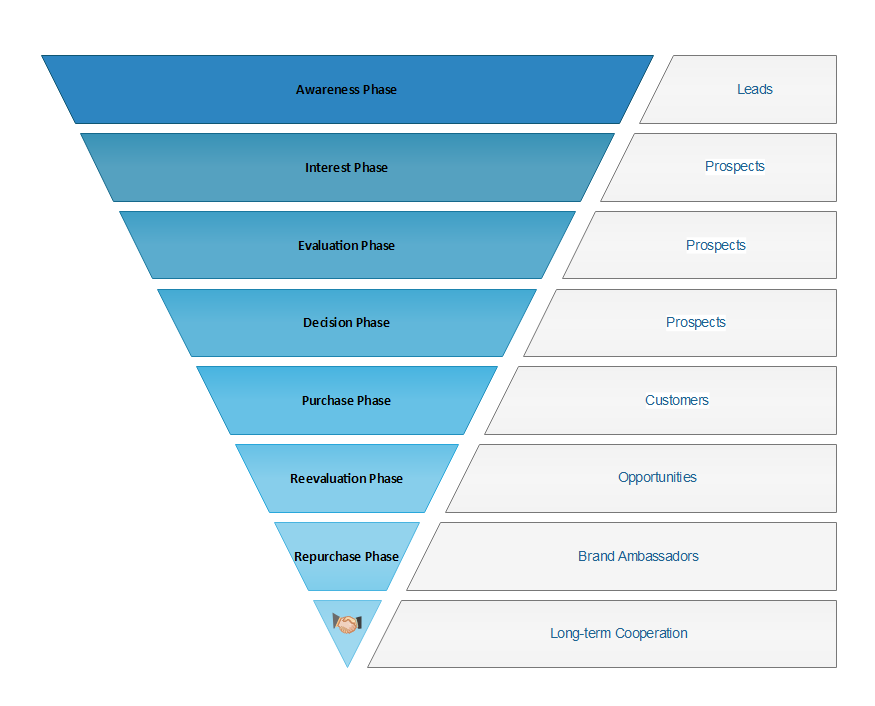
A sales funnel, also called a purchase funnel, is the pathway that captures sales prospects and moves them from awareness of your product to interest, desire and ultimately the sale. It can be broken down into seven sections i.e. awareness phase, interest phase, evaluation phase, decision phase, purchase phase, reevaluation phase, repurchase phase.
Funnel charts are used in sales to segment customers into different categories depending on their level of interaction with the company. A traditional sales funnel is shaped like an inverted triangle, and might have four sections: prospective customers, contacts, leads, and customers. Prospective customers usually take up the largest section of the funnel, while customers take up the smallest section of the funnel.
Using a funnel chart is beneficial for understanding how your customers behave. In addition, it can inform a company's sales strategy by letting them know how many customers they have in each segment, and which segments they should focus on to move as many customers down the funnel as possible.
EdrawMax
All-in-One Diagram Software
- Superior file compatibility: Import and export drawings to various file formats, such as Visio
- Cross-platform supported (Windows, Mac, Linux, Web, Android, iOS)
Part 2: How to Create A Funnel Chart?
Edraw funnel chart software empowers you to draw a funnel chart quickly and easily with prepared libraries. How to make a funnel chart easily? Using EdrawMax to create your own funnel chart.
Step 1: Open EdrawMax desktop software or EdrawMax web-based application.
Step 2: Navigate to [New] > [Marketing] > [Funnel Charts] in EdrawMax.
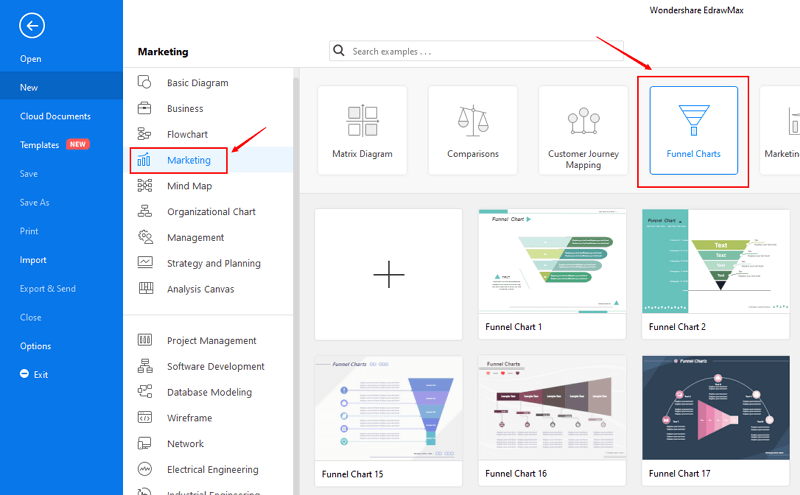
Step 3: Select one funnel chart template to edit on it or click the [+] sign to start from scratch. Also, you can use massive funnel chart symbols and elements from libraries in left menu to customize your funnel chart.
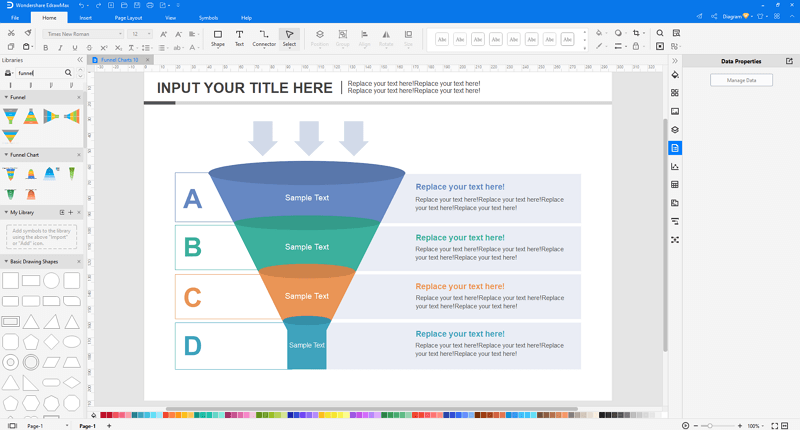
Step 4: Once finished your creation, you can export the file in multiple formats, including Graphics, PDF, editable MS Office file, SVG and Visio vsdx file.

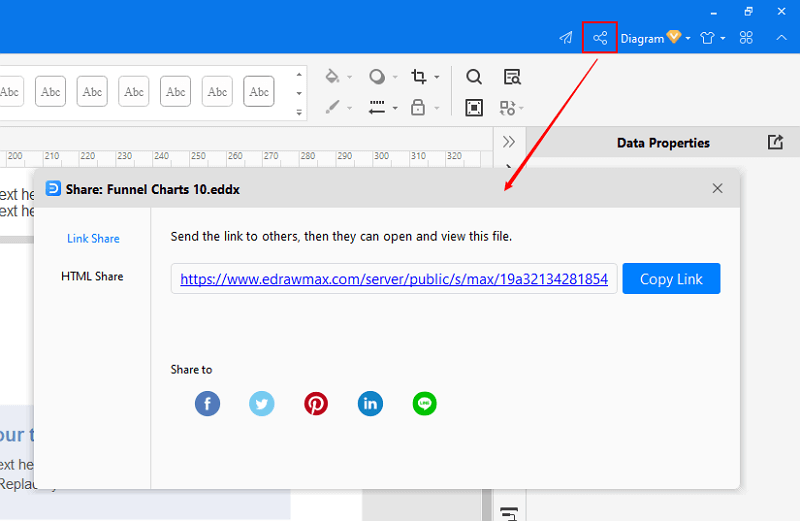
Step 5: Besides, you can share your funnel chart with others via social media and web page. Or publish your funnel chart in EdrawMax template gallery to show your work with others.
Part 3: The Best Funnel Chart Maker - EdrawMax
One of the most powerful programs that can compete with Microsoft Visio, EdrawMax is yet another diagramming software available for Windows, macOS, and Linux. The tool has several categories for almost all types of industries, and each category further has numerous templates to choose from, thus saving you a lot of time that you would otherwise waste in structuring a diagram, funnel chart for this example, from scratch.
Price: free to use; lifetime plan for individuals; license for team and business.
Part 4: Funnel Chart Examples
Following are a few funnel chart examples that would help you understand the diagrams' versatility and how many ways a funnel chart can be created:
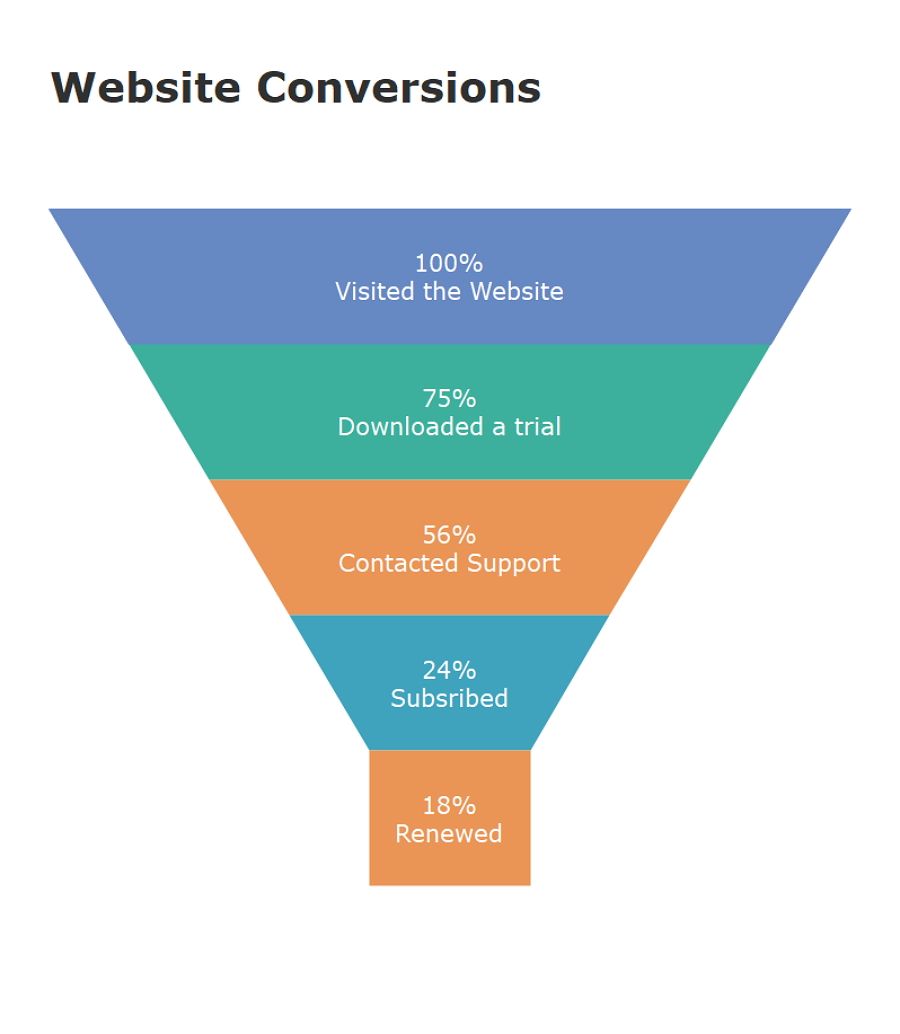
This example uses a funnel chart to show the conversion rate of a website.The conversion rate shows what percentage of all visitors performed a desired action, such as subscription or purchase.
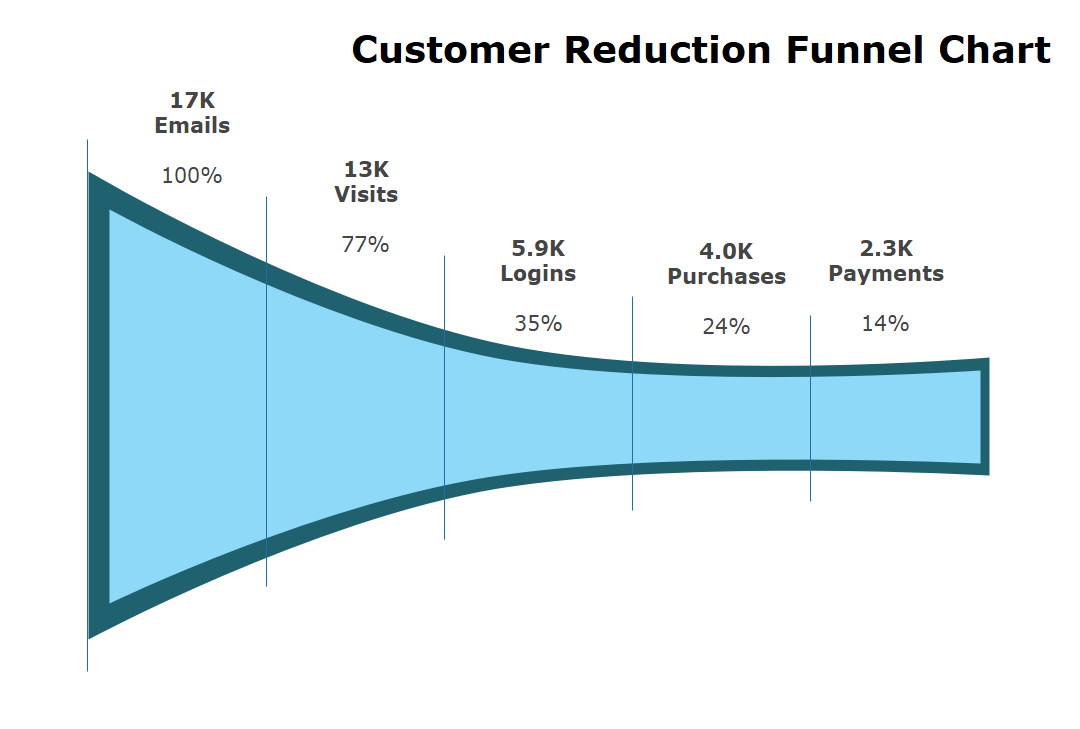
This funnel example shows the rate of people to purchase a product, from which the customers would go through from receiving Emails, to visit website, login and purchase the products. Via this process, the majority of customers may quit to purchase.
Part 5: Conclusion
Funnel charts are used in sales to segment customers into different categories depending on their level of interaction with the company.
EdrawMax is an easiest all-in-one diagramming tool, you can create funnel charts and any other type diagrams with ease! With substantial funnel charts symbols and cliparts, making funnel charts could be as simple as possible. Also, it supports to export your work in multiple formats and share your work with others. Get started to create your funnel charts now!


