Cause and Effect Diagrams for Health
Cause and effect Diagram for Health
Typically, cause and effect analysis is a diagram-based technique which combines brainstorming. It pushes you to consider all possible causes of a problem so that you can figure out the root cause, rather than just the ones that are most obvious. To use it flexibly, you can also list your plans in a cause and effect diagram, dividing the ultimate goal into smaller parts. Here are two examples.
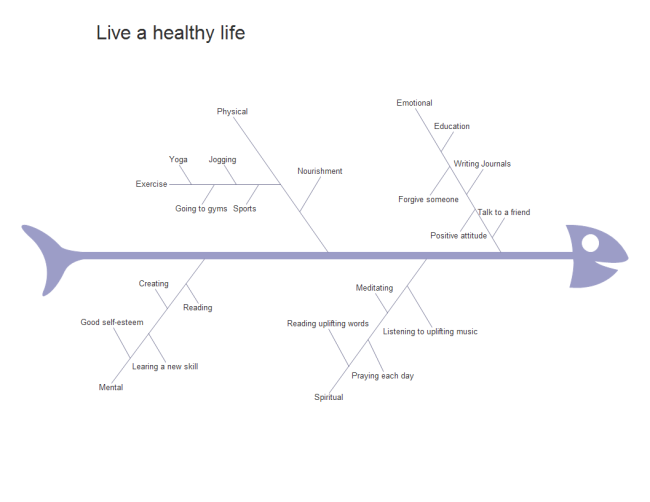
Cause and effect Diagram - Healthy Life

Every one dreams to live a healthy life which means not only physical fitness but also mental, emotional and spiritual health. In this diagram, plans for each field are listed in an organized and easy to understand way.
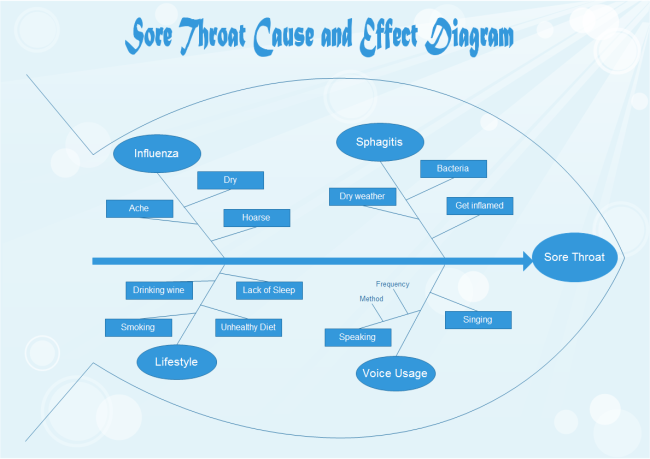
Cause and effect Diagram - Sore Throat

As you can see from the diagram, the sore throat is often caused by influence, sphagitis, unhealthy lifestyle or unreasonable voice usage. According to these causes, the solution to cure sore throat can be found out easily. For example, keeping a healthy lifestyle is always necessary and beneficial. Don't eat too much fried or spicy food is required. Voice usage should be under control. When singing or speaking, beware of the frequency and method. Drinking honey is a good way to protect your voice.
Simple Fishbone Diagram Maker - Make Great-looking Fishbone Diagram
The above examples are created by a simple and easy fishbone diagram maker - Edraw. Edraw fishbone diagram maker is specially tailored for the creation of professional and presentation-quality fishbone diagrams from templates. It only takes a few minutes to build an attractive infographic fishbone diagram. Use this smart software for smart fishbone diagram creation.
Discover why Edraw is an excellent program to create cause and effect diagram. Try Edraw FREE.
Lost Customer Analysis Fishbone Diagram


