Edraw Support Center
Get quick answers and step-by-step instructions in our support center.
Users Interface Overview
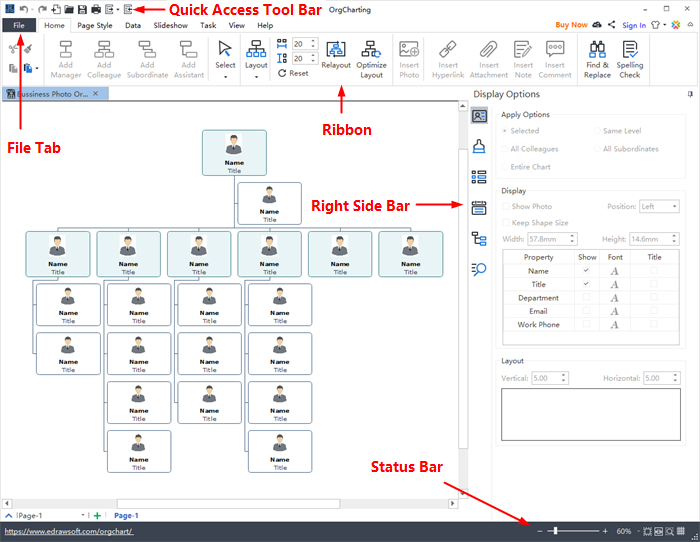
The interface shows the initial and overall window where you can create org charts. Here you can see File Tab, the Quick Access Toolbar, Ribbons, Right Sidebar and Status Bar at the bottom.
Quick Access Toolbar
In the quick access toolbar, you can find quick tools such as Undo/Redo, Create a New Org Chart, Open Files, Save, Print, Export and Import. You can hide or add any of these buttons by clicking the mini Down Arrow on the right. You can also choose to place the quick access toolbar on the top or at the bottom of the Ribbon.

Ribbons
- Home Tab
- Page Style
- Data
- Slideshow
- Task
- View
- Help
In the Home tab, there are plenty of helpful functions for creating org charts. You can add managers, colleagues, subordinates and assistants; change layout types; optimize layouts; insert photos, hyperlinks, attachments, notes and comments; adjust horizontal or vertical distances.

The Page Style tab is where you can format your org charts. You can select the theme styles, theme fonts and theme colors. You can also edit or remove the background of your org charts, or customize your own watermarks.

The Data tab is where you can set display options and quickly import/export your org chart data from your local files. More specifically, in the Data section, you can define fields, synchronize data, import/export data, and set text fonts, titles and more information for an individual employee.

In the Slideshow tab, you can add slides one by one, or auto-create your slides. Feel free to edit or remove any content in your slide pages. Once finished, you can preview your work in full screen, and then export or print the PPT.

The Task tab allows you to add, set and export Gantt Charts. You can create a new task by right-clicking on the employee box and choosing Add Task in the context menu. Alternatively, you can insert new tasks by directly clicking the Add Task button on the Task tab. Besides, you can set milestones, define task periods, edit task names, update task progress and priority, and assign tasks to members.

The View tab shows different view options. You can choose to zoom in or out your org charts or review it on the whole page. The Tree Panel allows you to edit data field content and it will synchronize with the org chart in the canvas.

In the Help tab, you can easily find tutorials, FAQ, contact information, keyboard shortcuts, and buttons to activate or deactivate the software.

Right Sidebar
The Right Sidebar has 6 tabs in total: Display Option, Style, Views Options, Data, Tree, and Search.
- Display Options
- Style
- Views Options
- Data
- Tree
- Search
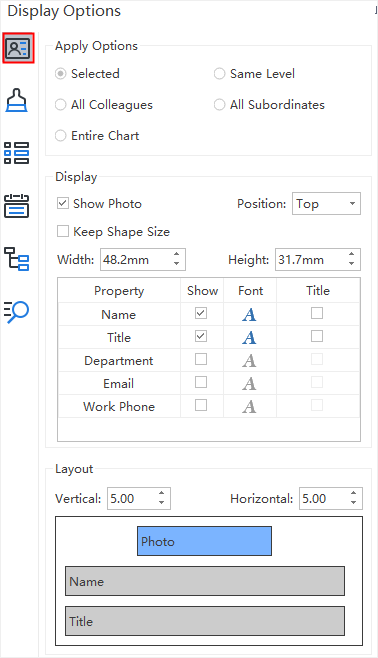
In the Display Options section, you can choose to show or hide your employees' photos, set the order, font, and position, etc. for displaying your employee details.
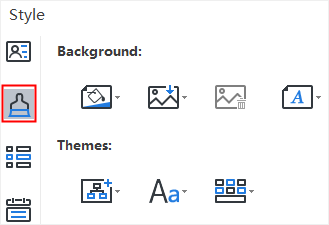
In the Style section, you can change the background colors, background images, watermarks, theme styles, theme colors, and the overall text fonts.
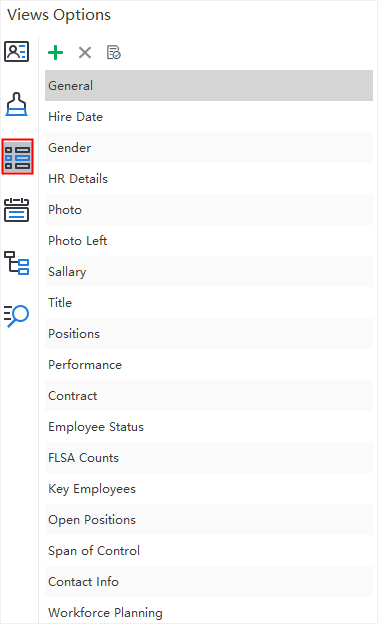
The Views Options section provides different choices of viewing org charts. Some chart elements and data which are excluded from your choice are hidden in this mode. Usually, the company organizational charts contain massive information on different categories. However, a person at a specific position may not always want to see all the data. For example, if you are an HR, you can click HR Details to view the information about human resources only.
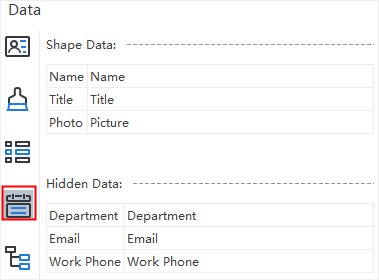
In the Data section, you can see the full details of an individual employee in your current org chart, including the name, title, photo, department, contact information.
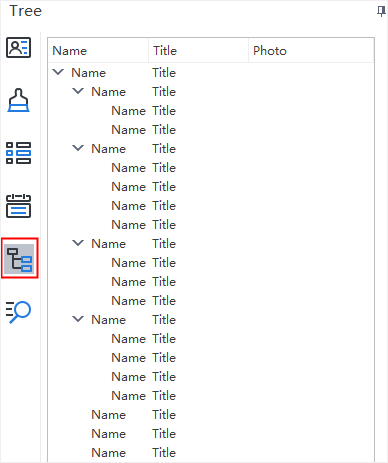
In the Tree section, you can quickly go through all the information in your current org chart. If you want to modify the information of certain employee, you can double click the name, title or photo to input the right details.
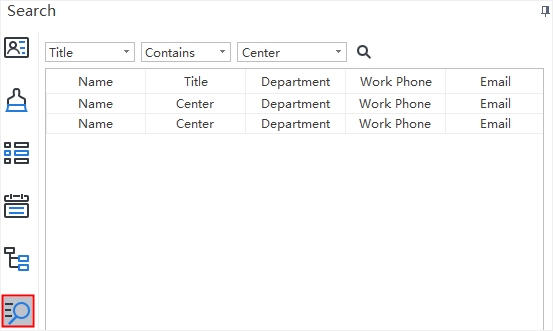
In the Search section, you can search any specific employee information in your org charts, such as the name, title, location, gender, department, etc. Furthermore, you can also search for numbers like salaries, work performance ratios, etc.
