Edraw Support Center
Get quick answers and step-by-step instructions in our support center.
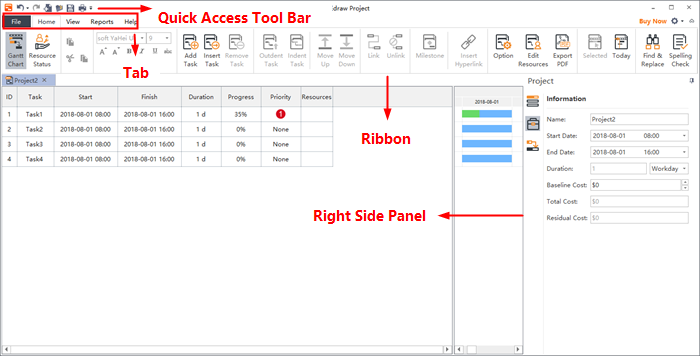
The interface shows the initial and overall window where you can create Gantt Charts. Here you can see the Quick Access Toolbar, Tabs, Ribbon and Right Side Panel.

Quick Access Toolbar
From the Quick Access Toolbar you can find quick tools for Undo/Redo, Create a New Gantt Chart, Open Files, Save, and Print. You can hide or add any of these buttons by clicking the mini Down Arrow on the right. You can also choose to place the Quick Access Toolbar below or above the Ribbon.

Ribbons
- Home Tab
- View
- Reports
- Help
In the Home tab, you can add, insert, remove, indent, outdent, move up and down tasks; set milestones; link and unlink selected tasks; insert hyperlinks and set overall Gantt Chart options.

The View tab shows different view options for Gantt charts. You can apply a theme, zoom in or out the chart, expand or collapse subordinate tasks.

Edraw Project comes with a set of predefined reports. You’ll find all of these on the Reports tab, including Resource Status, Critical Tasks, Resource Cost, Resource Work and Task Allocation, etc. However, these reports are not customizable.

From the Help tab you can easily find related guides for reference, including Tutorial, FAQ, Shortcut Key, Contact Us, Activation and Deactivation.
