Free Graphic Organizers Templates
Graphic organizers that lead to better, more effective teaching and learning are really useful and important. Well-designed graphic organizer templates are invaluable to a teacher, who has to work hard to get the attention of today's students.
Download our Free Graphic Organizers Templates in Software Package to Use However You Like
Graphic Organizers Template
Edraw is used as a graphic organizers software coming with ready-made graphic organizers templates that make it easy for anyone to create dynamic graphic organizers. The templates are easy to use and free. Edraw can also convert all these templates into PowerPoint, PDF or Word templates.
Using Edraw Graphic Organizers Software
Creating a graphic organizers in Edraw is easy. It only takes a few seconds to choose a
basic template, insert text and images, and add the finishing touches.
If you want to use a ready made template, go to graphic organizers templates page and
choose the Graphic Organizers that best suits you.
PowerPoint Graphic Organizers Template
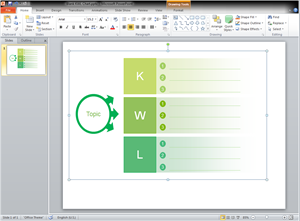
Easy to Create Graphic Organizers in PowerPoint
When you finish creating your graphic organizers in Edraw, one click on the Export button will transfer your drawing into MS PowerPoint presentation.
This feature enables teachers to display concepts or summaries on the PPT presentation easily.
Word Graphic Organizers Template
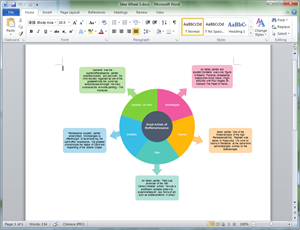
Personalize your Graphic Organizers and Give it the Look and Feel that You Want
The graphic organizer exported to word remains in vector format. You can click to change text, shape size and apply quick style for shapes in word.
PDF Graphic Organizers Template
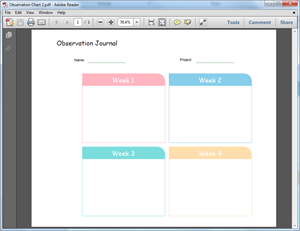
Create Graphic Organizers for PDF
To export graphic organizers to PDF is just one button click away. The graphic organizers in PDF is scalable. You can zoom in the file to view bigger image without losing clarity.
More Graphic Organizers Templates
Some basic graphic organizers are introduced below attached with beautiful templates available to download and cutomize, such as T Chart, KWL chart, observation chart, tree chart, main idea and details chart, columns chart, idea wheel, etc.
T Chart
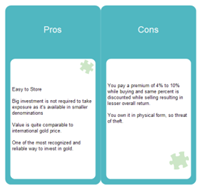
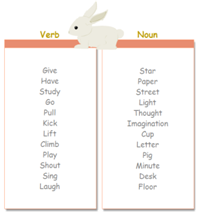
The T chart looks like the letter "T". It is used to compare and contrast ideas graphically, such as diaplaying pros and cons, presenting scientific phenomena, or listing any topic having two viewpoints.
|
|
Vocabulary Study Graphic Organizer
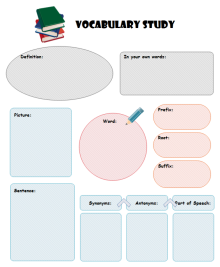
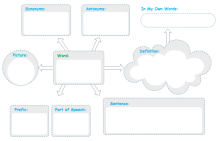
These vocabulary graphic organizers can guide students in the primary grades to learn new words.
|
|
KWL Chart
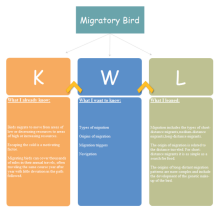
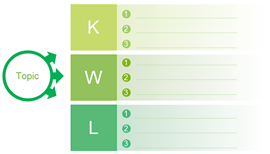
The letters KWL represents "what I know", "what I want to know" and "what I've learned from this lesson". It's a common graphic organizer that is popular for teaching and learning. The KWL charts help students to become more thoughtful, engaged readers. It can be used to do research projects and organize information to help study for tests as well.
|
|
Observation Chart
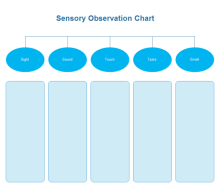
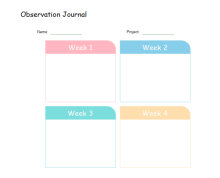
Observation chart is a practical recording tool in science class. It helps students to write down what they have observed for a particular natural phenomenon or experiment.
|
|
Venn Chart
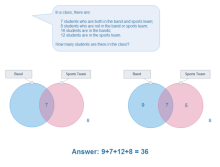
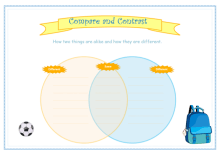
Venn chart is usually used when solving problems as sort, compare, and contrast items. It shows all possible logical relations between sets. The areas where the circles overlap represent something in common, while the non-intersecting areas of the circles represent the differences.
|
|
Cycle Diagram
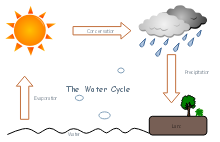
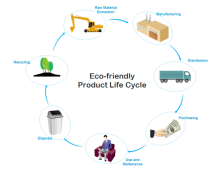
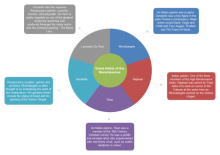
A cycle diagram is used to present how a series of events interact repeatedly through a cycle.
|
|
Ideal Wheel
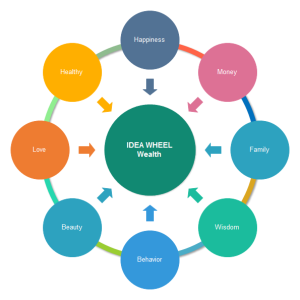
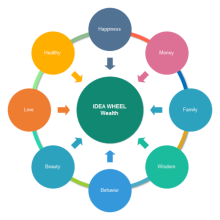
Ideal wheel is used to display the main idea in the middle and the supporting ideas in the surrounding circles.
|
|
Concept Map
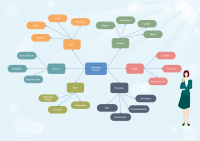
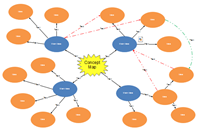
A concept map is used to help students organize and represent knowledge of a subject. Concept maps start with a main idea in the middle and then branch out into specific topics.
|
|
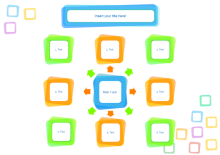
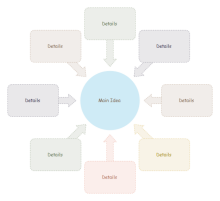
Main Idea and Details Chart
Main idea and details chart is a type of graphic organizer shows the hierarchical relationship between major concepts and their subordinate elements. It is beneficial in helping students distinguish central ideas and their corresponding details from less important information.
|
|
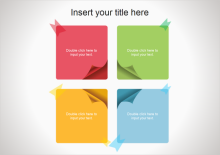
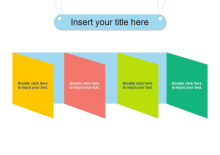
Four Columns Chart
Four columns chart is a kind of graphic organizer used to help students organize their thoughts by comparing and contrasting four things. The number of columns can be changed depend on the classifications being made.
|
|
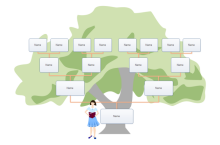
Tree Chart
Tree chart is a type of graphic organizer that shows how items are related to one another in a hirarchical structure.

|
|
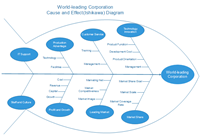
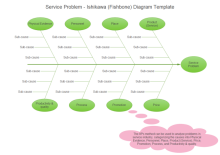
Cause and Effect Chart
Cause and effect diagram is a kind of graphic organizer used to identify all of the likely causes of the problems. It's useful to develop the students' abilities of analyzing problems.
|
|
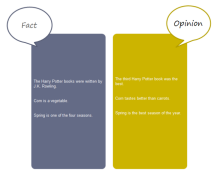
Fact and Opinion Chart
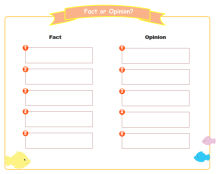
Fact and opinion chart is a kind of chart where you put the main topic or subject on the top, write the facts on the left fact column and then write your opinions on the right opinion column. It's a useful tool to help student distinguish what is a fact and what is an opinion.
|
|
Sequence Chart
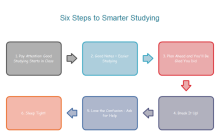
A sequence chart shows a series of steps or events in the order in which they take place. It is an excellent tool for teaching students the steps necessary to reach a final point.
|

|
