Graphic Organizers Templates | Discover Benefits for Education

Overview of Graphic Organizers
Graphic organizers include various kinds of graphs and diagrams that organize ideas visually. They help readers to classify ideas and communicate effectively. They are of great help for teaching and learning for their feature of visualization. Use a graphic organizer to empower your students, arouse their curiosity, and have fun in study.
Watch this video to discover 12 different types of graphic organizers.
Benefits of Graphic Organizer for Teaching and Learning
1. Show Relationship
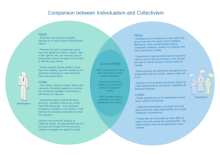
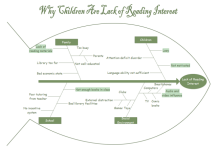
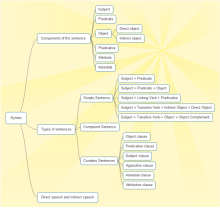
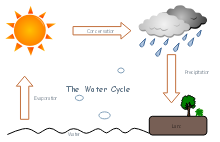
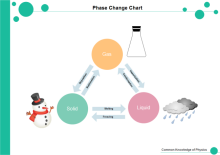
With vivid shapes, symbols and connectors, graphic organizers visualize the relationship between different parts. For example, Venn diagrams help students see and understand the common points and differences of things. Cause-and-effect diagrams help student find out the causes and results of an event.Mind map can boost students' creative thinking when they understand how different subtopics relate to the main topic. Flowcharts presents the sequence relation clearly step by step.
See some graphic organizer templates below. Click the pictures or links to view large version or download the templates as you like.
|
|
|
2. Visualize and Simplify Ideas
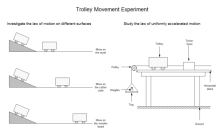
Since a picture is worth a thousand words, sometimes, graphic organizers can simplify complicated ideas by visualizing them. Seeable ideas are more understandable, especially for visual learners.
Here are some graphic organizer templates for free download and editing.
|
|
|
3. Organize Information
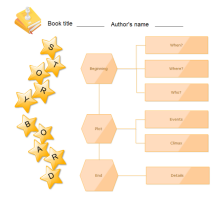
When there is a large amount of information, it is hard for the brain to decode and digest. The graphic organizer can logically organize the information. If the learning process lasts for a long time, to comprehend and memorize information in a structured way is more relaxed. For example, a timeline is especially helpful for remembering the chronological sequence of historical events. A storyboard can help students summarize a story in terms of time, place, event, and climax. Teachers can use a KWL chart to engage students better during class.
Check the following graphic organizer templates for free download and editing.

|
|

|
How to Create Stunning Graphic Organizers?
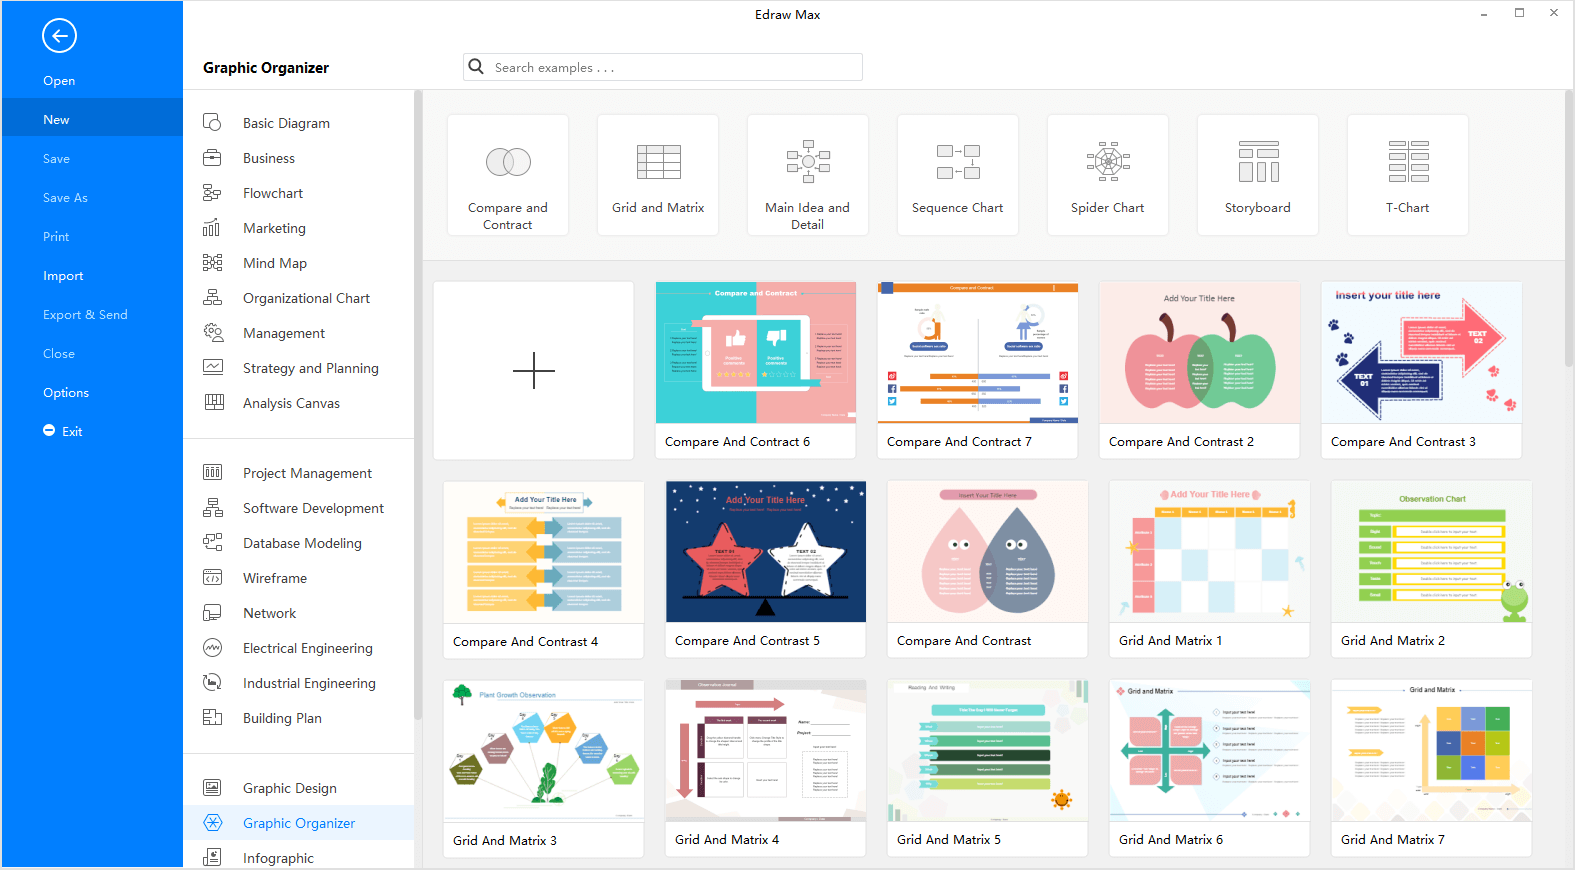
First of all, we recommend to download a professional graphic organizer software.

An all-in-one platform for 210+ diagrams.
・ Simple alternative to Visio
・ 26k+ symbols
・ 10K+ free templates
・ 10+ AI diagram generators


Step 1: Get started quickly with an appropriate graphic organizer template.
Step 2: Customize the template to fit your needs.
Step 3: Add your content.
Step 4: Export your works to the files you want.
More Related


