Gauge Chart Creator
Create professional gauge charts for free with easy-to-edit templates and symbols.
Trusted By Over 30 Million Users & Leading Brands


Why EdrawMax to Make Your Gauge Charts?
Gauge charts for every need
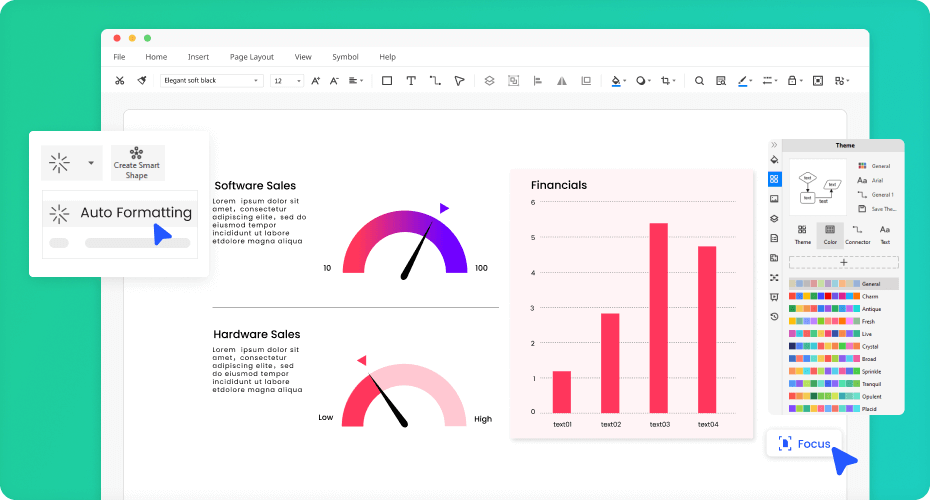
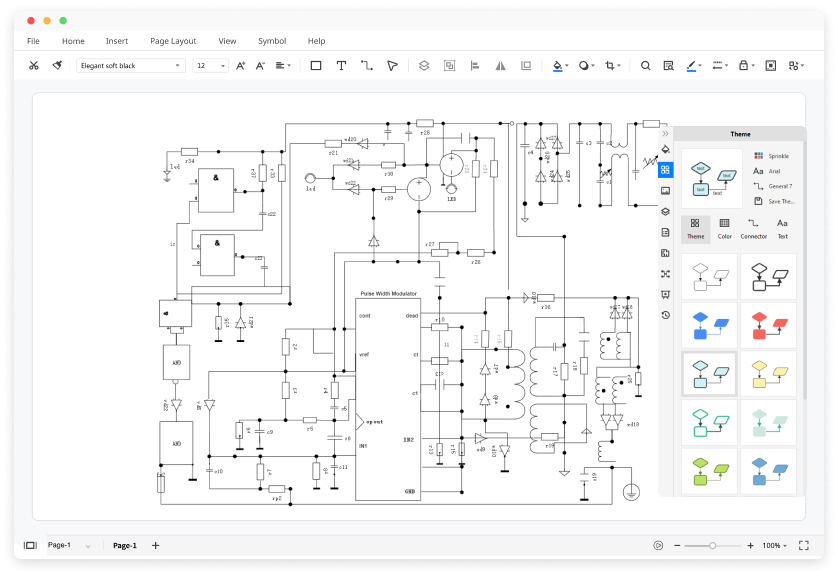
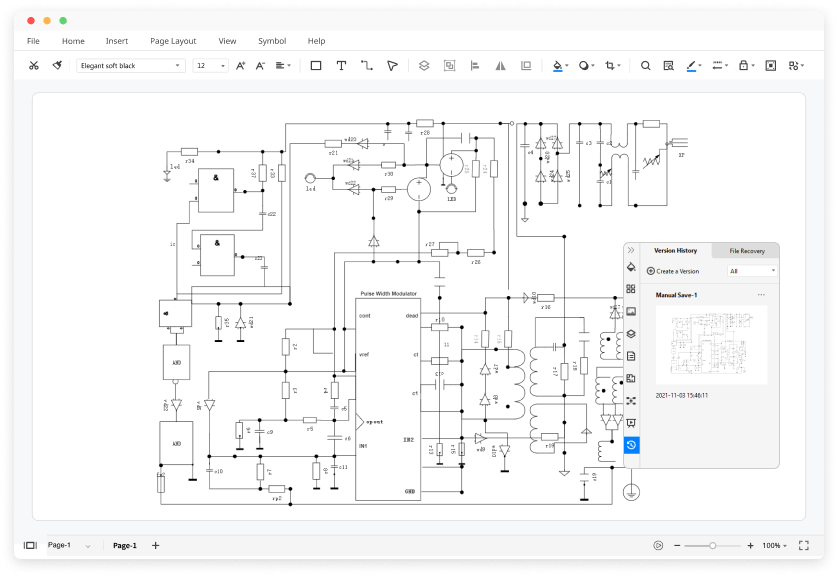
Creating gauge charts is a breeze
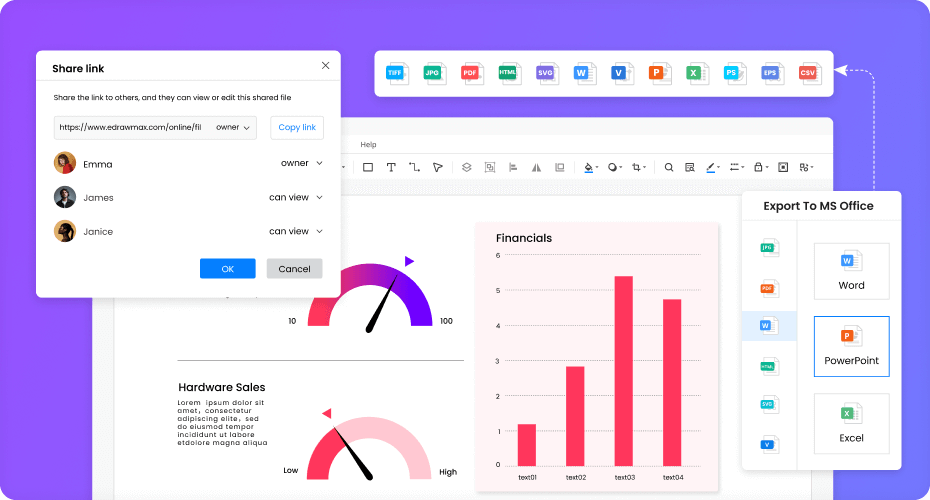
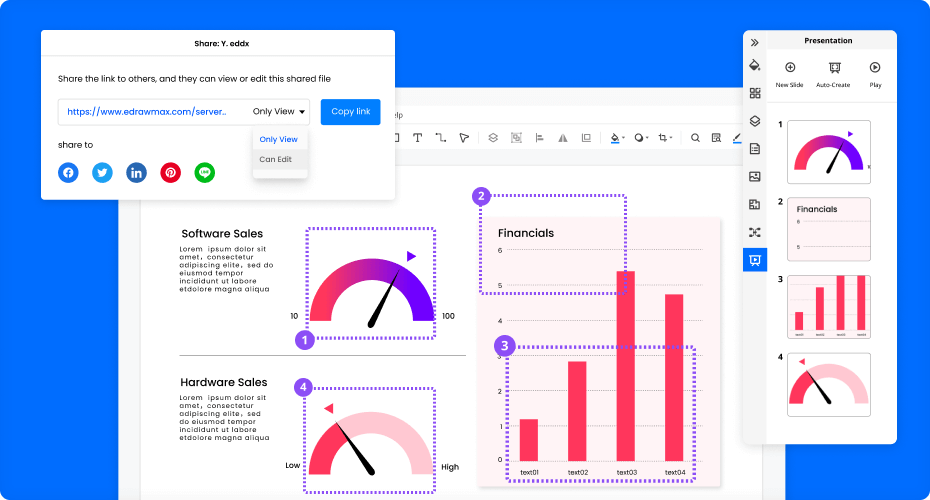
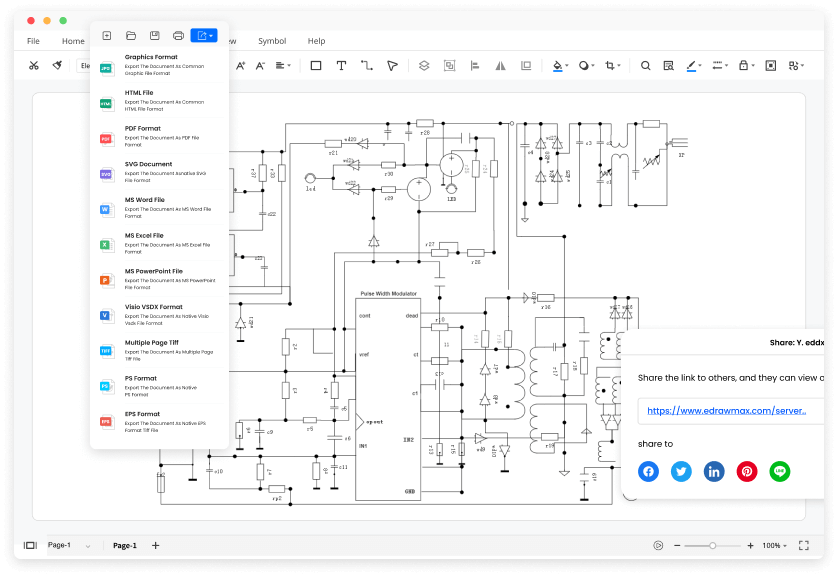
Store and share extremely easy
Print, embed, and present without limit
More Features Of Gauge Chart Creator
Visio files import and export
Customized fonts and shapes
Insert images and attachments
Infinitive canvas
Various color theme
File encryption and file backup
How to Make a Gauge Chart?
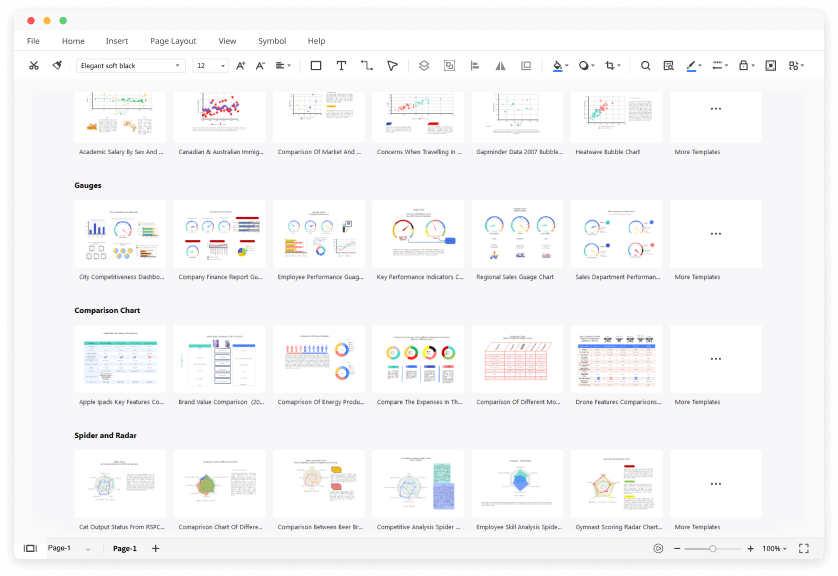
Edraw Gauge Chart Templates
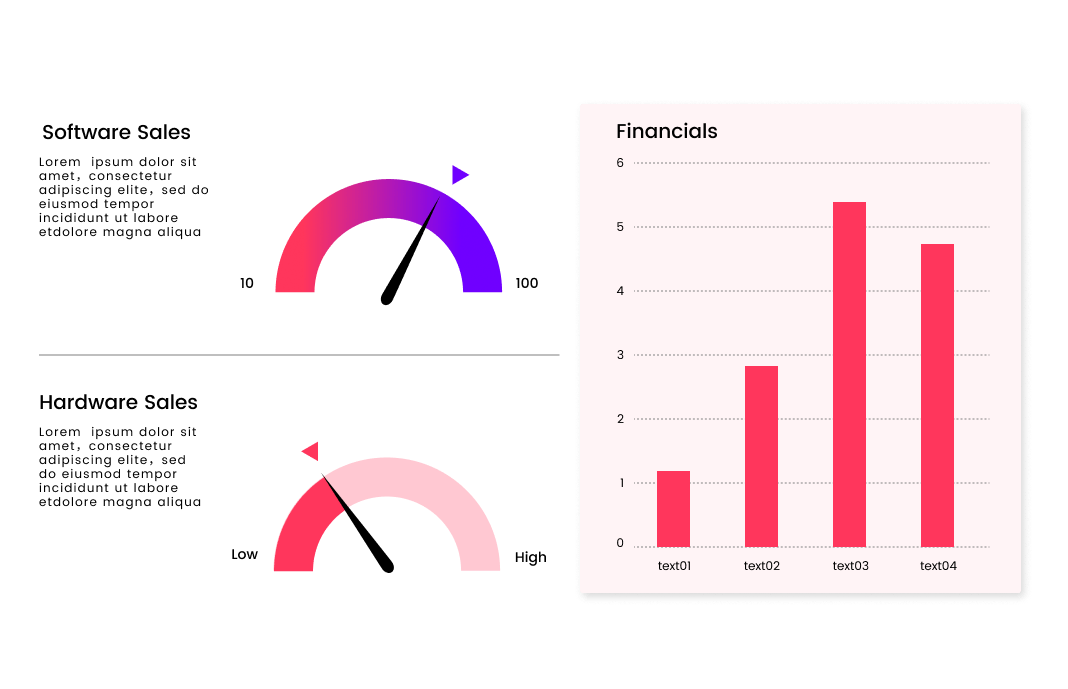
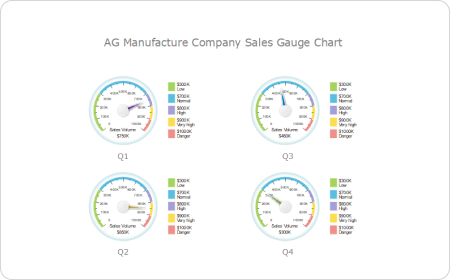
Gauge Chart
You can create your gauge chart templates by dragging the needed elements on a blank gauge chart template.
Quarter Gauge
A quarter gauge is a line that divides a graph into four equal parts. It indicates the difference between one value and the next and can be drawn on any scale, from inches to kilometers.
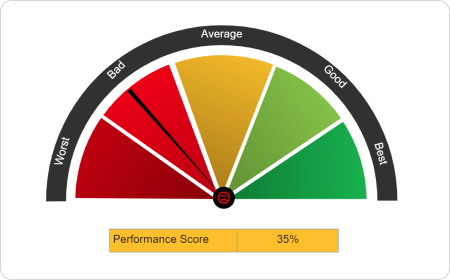
Rating Meter
A rating meter is a graphical representation of an attribute. This attribute can be anything you can imagine, such as quality or quantity.
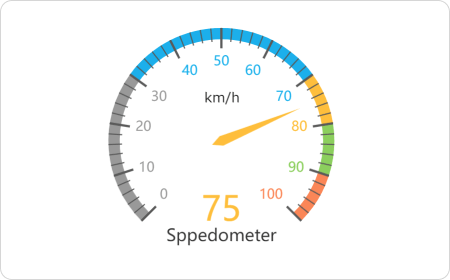
Speedometer
A speedometer charts the relative size of your project over time. The only difference between a speedometer and a gauge chart is that a speedometer is flipped.
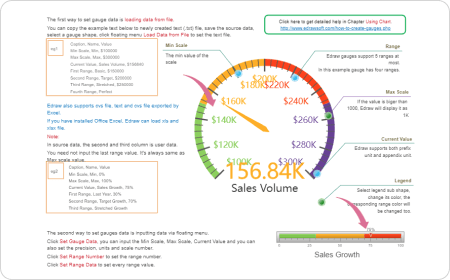
Gauge with Trend
With EdrawMax, you can create a gauge chart with a trend.
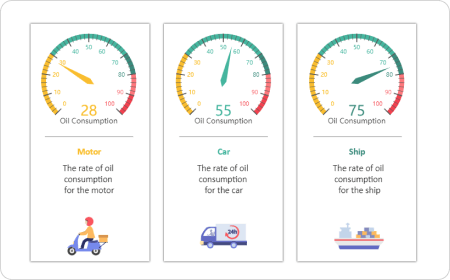
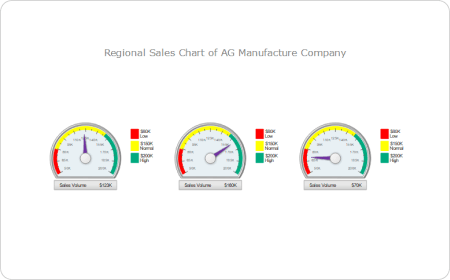
Speed Gauge Chart
The speed gauge chart is a good way to quickly and easily measure how long it takes to complete a task.
Gauge Chart FAQs

Does EdrawMax have any free gauge chart templates?
Except for the pre-made gauge chart templates in EdrawMax, you can download and customize templates from our Template Community. All the community-made templates are free to use for Edrawers.
How can I share my gauge charts with others who don't use EdrawMax?
When your gauge chart is complete, you can post it on social media, publish on Edraw Template Community, or export the file as Word, Excel, PowerPoint, Visio, PDF, SVG, PNG and JPG. EdrawMax is dedicated to delivering a superior user experience.
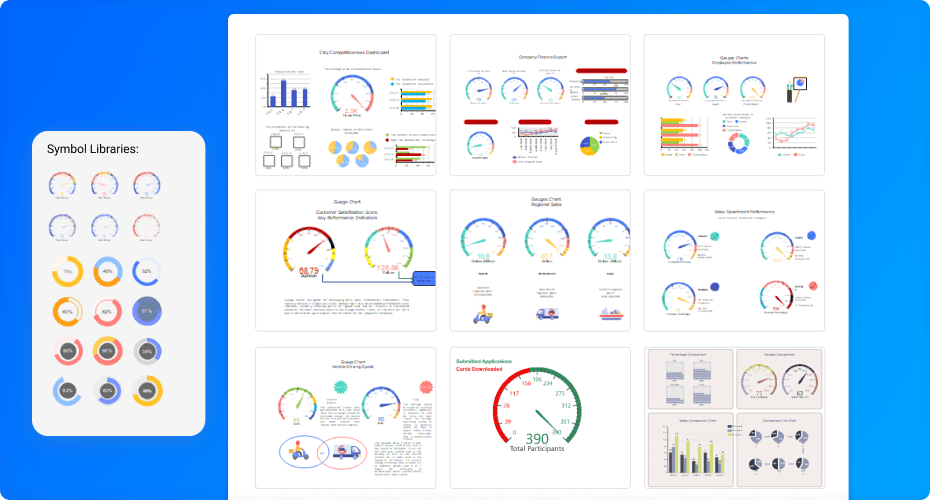
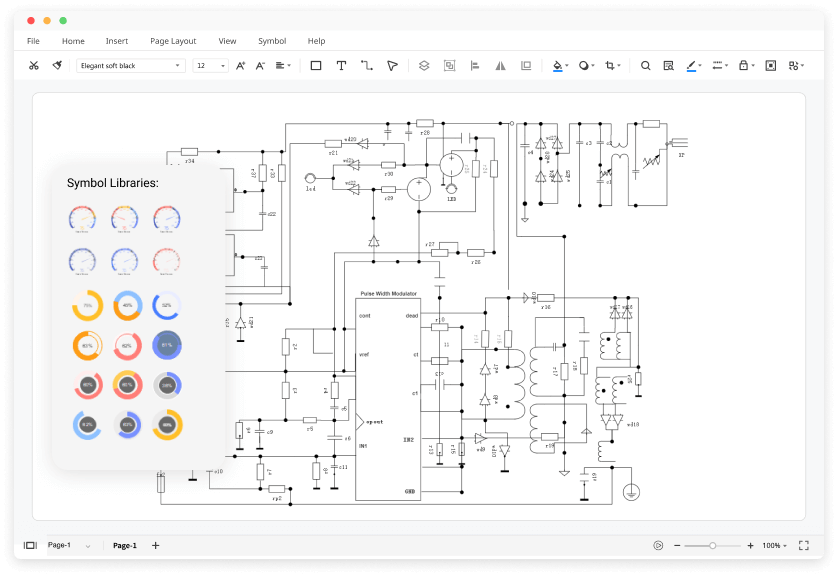
How can I find gauge chart symbols that I need?
No worries. You can find gauge chart symbols by opening and searching in the preset symbol libraries of EdrawMax.
How can I create a gauge chart from scratch?
You can create a gauge chart from scratch by dragging and dropping symbols from the libraries and customizing colors, fonts, lines, etc. All the symbols in EdrawMax are vector, editable, and catered to different types of gauge charts.
Is EdrawMax's gauge chart maker free?
YES! It is free to create different gauge charts in EdrawMax. There are free templates, symbols, and easy-to-use editing tools for making gauge charts. Just download it and try EdrawMax now. You will love it right now.
More Resources
Unlock your diagram possibilities by exploring more diagram makers here.
Find more ideas, tips and knowledge to help create gauge charts.
Need help? Find the instruction or contact support here.