Trusted By Over 30 Million Users & Leading Brands

cmpa
mckesson
deloitte
amazon
facebook
apple
puma
nike
sony
pilz
ge
kpmg
fujifilm
mitsubishi_electric
ublox
daimler
toyota
walmart
harvard_university
glencore
at&t
amerisource_bergen
aramco
shell
total

Why EdrawMax to Make Your Gauge Charts?

Gauge charts for every need
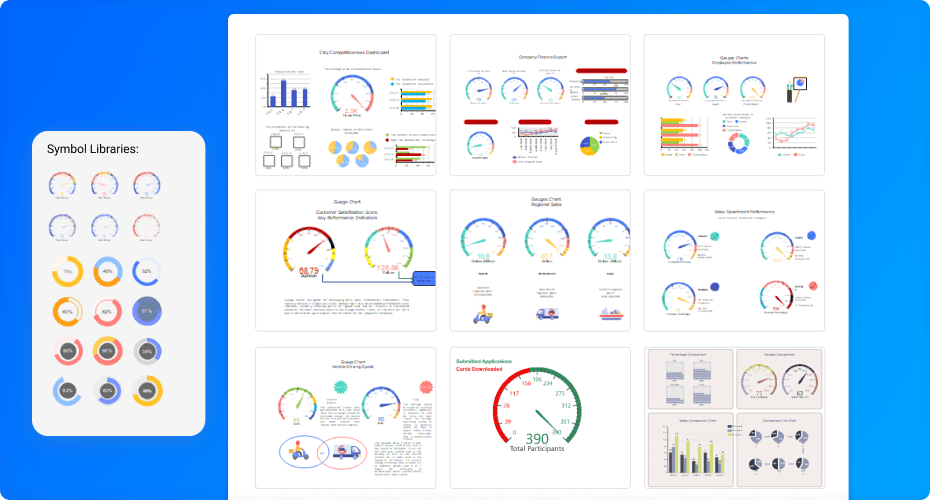
Show quantitative value: Gauge charts show the status of a project in a single number. A single data value presented inside a quantitative framework should be shown.

Monitor KPI: Gauge charts are an excellent tool for gauging the health of your project. They can help you understand how your project progresses and identify any performance issues before they become serious problems.

Communicate progress: Gauge charts can be a great way to share project information with your team, clients, and stakeholders.

for every need

Creating gauge charts is a breeze
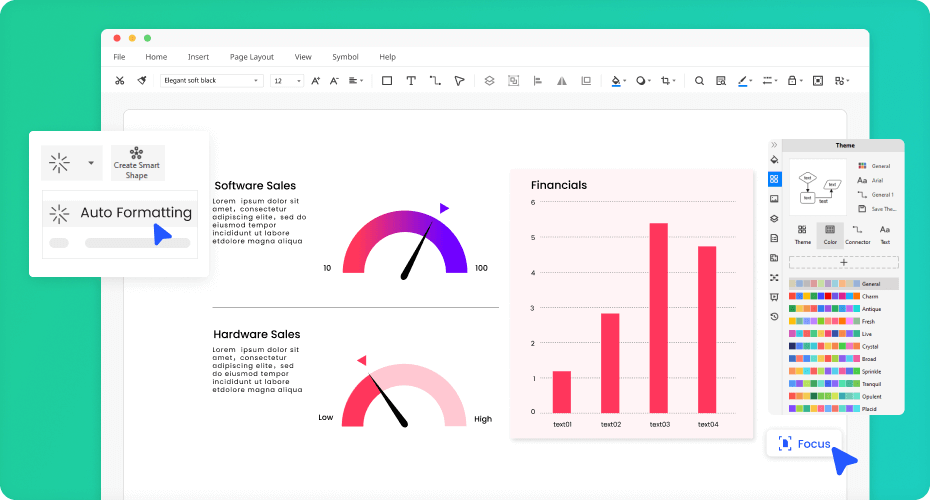
Pre-designed templates: The EdrawMax software has an extensive library of pre-made gauge charts for you to use. You can repurpose a pre-made gauge chart from a template.

Import/export data tools: EdrawMax gauge chart creator has a built-in function for importing/exporting data to a gauge chart template. This is a great way to reuse gauge charts.

Handy tools for customizing: EdrawMax's built-in color picker makes it easy to pick the right color for your gauge chart. You can add a gradient to your gauge chart with a simple click.

create with EdrawMax

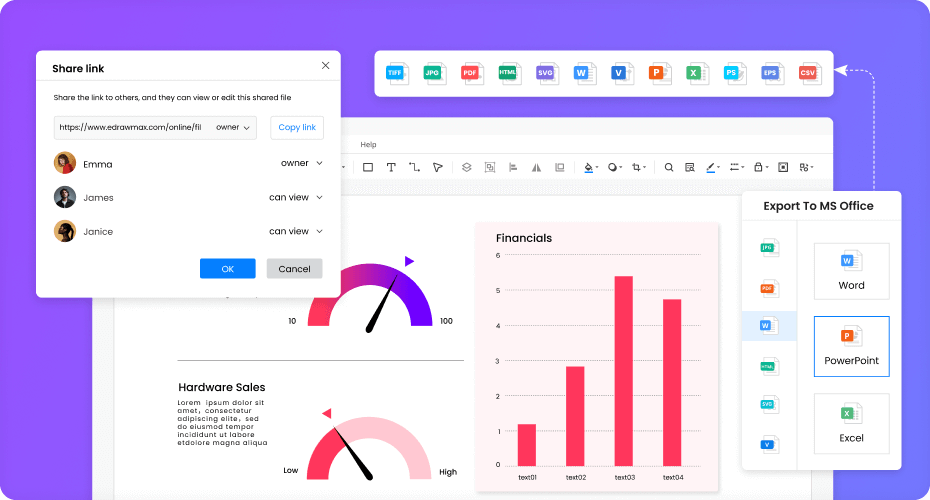
Store and share extremely easy

Keep your information safe: This awesome feature of EdrawMax makes it easy to save your project in the cloud. You can access it from any computer, smartphone, or tablet.

Multiple export options: You can export files in many different formats. This allows you to store files on your computer or tablet in the cloud.

Multiple share options: You can share them on Twitter, Facebook, Linkedin, Pinterest, Email, etc.

collaboration

Print, embed, and present without limit
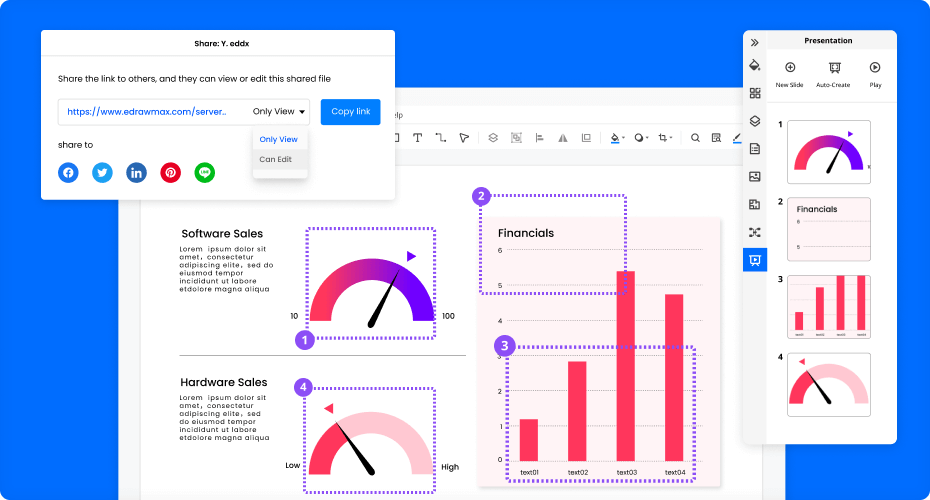
High-resolution printing: EdrawMax gauge chart creator allows you to print at up to 4x the resolution of your printer.

Embed on any place: EdrawMax has a very simple and intuitive embedding function. Simply drag and drop your gauge chart into your presentation, and you are done!

Present like a pro: You can present your project visually, which is impossible with a typical gauge chart. As soon as you press F5, the diagram will be seen in full-screen mode.

presentation

More Features Of Gauge Chart Creator

Visio files import and export
Customized fonts and shapes
Insert images and attachments
Infinitive canvas
Various color theme
File encryption and file backup

I'm impressed with this software. I used it for my last project. The interface is very user-friendly and easy to navigate. I can create custom gauge charts, edit them, and export charts to Excel for use in a spreadsheet. I would highly recommend EdrawMax to anyone looking to create or edit gauge charts.

EdrawMax is the best gauge chart software I have used so far. I am an experienced developer, and I have used much other software, but I have never found a software that can do everything I want to do in one software package.

EdrawMax is also easy to share with other users because it is software that can be accessed online, and you can add your chart to a web page. I can also save my charts as image files and send them to my friends by email.

Edraw Gauge Chart Templates

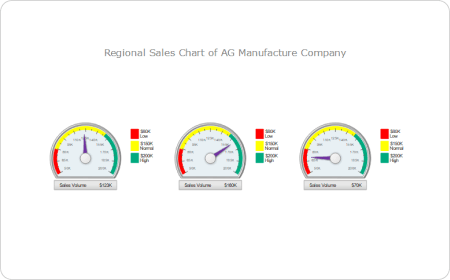
Gauge Chart
Gauge Chart
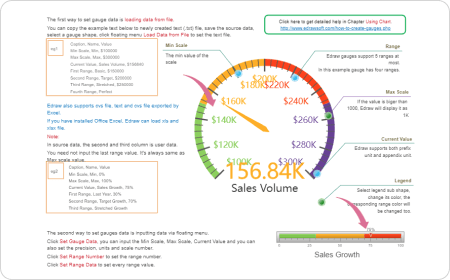
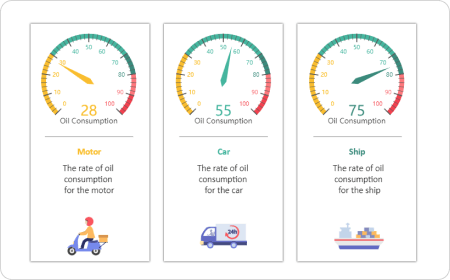
You can create your gauge chart templates by dragging the needed elements on a blank gauge chart template.
Quarter Gauge
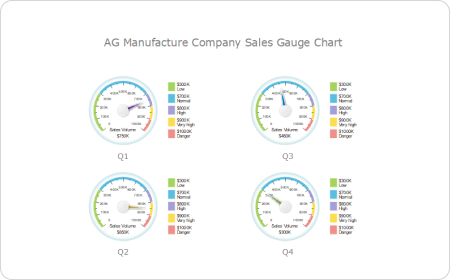
Quarter Gauge
A quarter gauge is a line that divides a graph into four equal parts. It indicates the difference between one value and the next and can be drawn on any scale, from inches to kilometers.
Rating Meter
Rating Meter
A rating meter is a graphical representation of an attribute. This attribute can be anything you can imagine, such as quality or quantity.
Speedometer
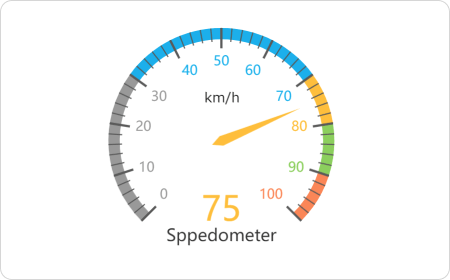
Speedometer
A speedometer charts the relative size of your project over time. The only difference between a speedometer and a gauge chart is that a speedometer is flipped.
Gauge with Trend
Gauge with Trend
With EdrawMax, you can create a gauge chart with a trend.
Speed Gauge Chart
Speed Gauge Chart
The speed gauge chart is a good way to quickly and easily measure how long it takes to complete a task.

Gauge Chart FAQs

Except for the pre-made gauge chart templates in EdrawMax, you can download and customize templates from our Template Community. All the community-made templates are free to use for Edrawers.
When your gauge chart is complete, you can post it on social media, publish on Edraw Template Community, or export the file as Word, Excel, PowerPoint, Visio, PDF, SVG, PNG and JPG. EdrawMax is dedicated to delivering a superior user experience.
No worries. You can find gauge chart symbols by opening and searching in the preset symbol libraries of EdrawMax.
You can create a gauge chart from scratch by dragging and dropping symbols from the libraries and customizing colors, fonts, lines, etc. All the symbols in EdrawMax are vector, editable, and catered to different types of gauge charts.
YES! It is free to create different gauge charts in EdrawMax. There are free templates, symbols, and easy-to-use editing tools for making gauge charts. Just download it and try EdrawMax now. You will love it right now.

More Resources

Unlock your diagram possibilities by exploring more diagram makers here.
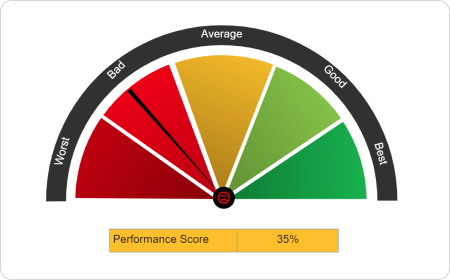
Find more ideas, tips and knowledge to help create gauge charts.
Need help? Find the instruction or contact support here.