Gantt Chart
As a project manager, if you are working on several assignments simultaneously, you may want to keep a close eye on each of them to avoid any miscalculations or ending up having inconsistencies in the final outputs. This is where a Gantt Chart comes into play.
A correctly drawn Gantt Chart not only makes the monitoring easy but also enables you to predict the completion date/duration while assessing the engagements and availability of each person involved in the process at the same time.
That said, in the following sections, you will learn what a Gantt Chart is, why do you need one, what its significance is, and how to create such a diagram to make your professional life easier.
1: What Is a Gantt Chart?
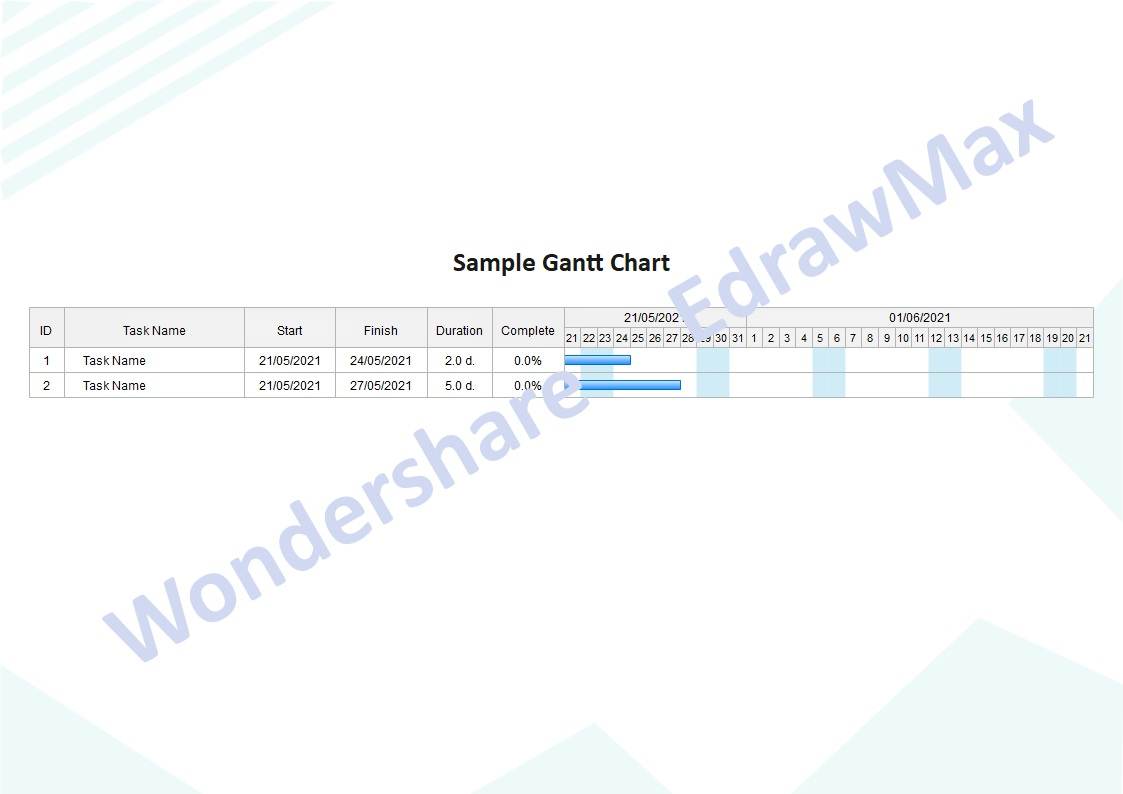
In simple words, a Gantt Chart is a diagram that uses bars to illustrate the progress of the tasks of a project. Typically, the drawing includes the title of the project, the modules it has, the start and expected completion date of those sections, the duration it took (or will take) to complete them before they can be moved to the next phase, and other relevant project-specific details.
2: Purpose and benefit
As discussed above, a Gantt Chart is used to monitor a project or multiple projects at a single glance. The bar-like figures that the diagram is populated with represent various stages and progress of the tasks. This makes the project auditing process easy. Simply put, a Gantt Chart eliminates the need to ask for updates about the projects separately from their corresponding engineers or persons in charge.
One of the most significant advantages of having a Gantt Chart handy is that it saves you several hours that, as a project manager, you would otherwise have to spend in assessing and monitoring each project’s progress individually at regular intervals. With a Gantt Chart, you can also manage the manpower and assign the personnel to the tasks they specialize in.
3: Symbols and Icons
Gantt Charts are extremely simple in nature and do not contain complex shapes or icons, as is the case with other diagrams. In fact, because these diagrams merely use bars, columns, and text, only the different types of effects and colors are used to beautify these elements. However, it is imperative to format the tables, use a font that has clear text, and populate the charts with the correct values to get accurate information.
The most common objects that are used in a Gantt Chart are demonstrated below:
4: What to do Before Creating a Gantt Chart?
Because a Gantt Chart illustrates the projects, their work progress, and the people assigned to them, there are a couple of things that you must keep in hand before starting with the creation process. These points include:
- Ingredients
- Interaction
- Predictions
- A PC Application
Make sure to collect all the details about the projects you are working on. If possible, list them on a piece of paper to be accessed easily while preparing the diagram.
Discuss the progress of the projects with their corresponding people, and gather as much information as possible about the personnel involved in the process. This will not only help you create an accurate Gantt Chart, but it will also enable you to allocate the tasks to the right people and assess who is available to take the next assignment.
Try getting a rough idea of how much time each task would take to get to the completion stage and approximately when you can expect the whole project to complete. These details would be helpful in preparing the first draft of the Gantt Chart. As things will get to the practical ground, you can modify the diagram accordingly.
If you are aware of how the computers and operating systems work, it would be a good idea to use an efficient PC program like EdrawMax developed by one of the leading IT companies, Wondershare to draw a Gantt Chart. Doing so will enable you to prepare an error-free and correctly calculated vector-based illustration that can be enlarged according to your requirements without deteriorating the picture quality. Another advantage of using an app is that the final draft of the chart can be shared among all the co-workers digitally and can also be printed if need be.
5: How to Make Gantt Chart in EdrawMax?
Wondershare EdrawMax is a computer software specifically dedicated to diagram and chart creations. The tool is available for both Windows and Mac operating systems and is populated with several built-in templates and libraries for all types of trades including building constructions, industrial equipment, database modeling, and much more.
You can learn how to create a Gantt Chart in EdrawMax by following the instructions given below:
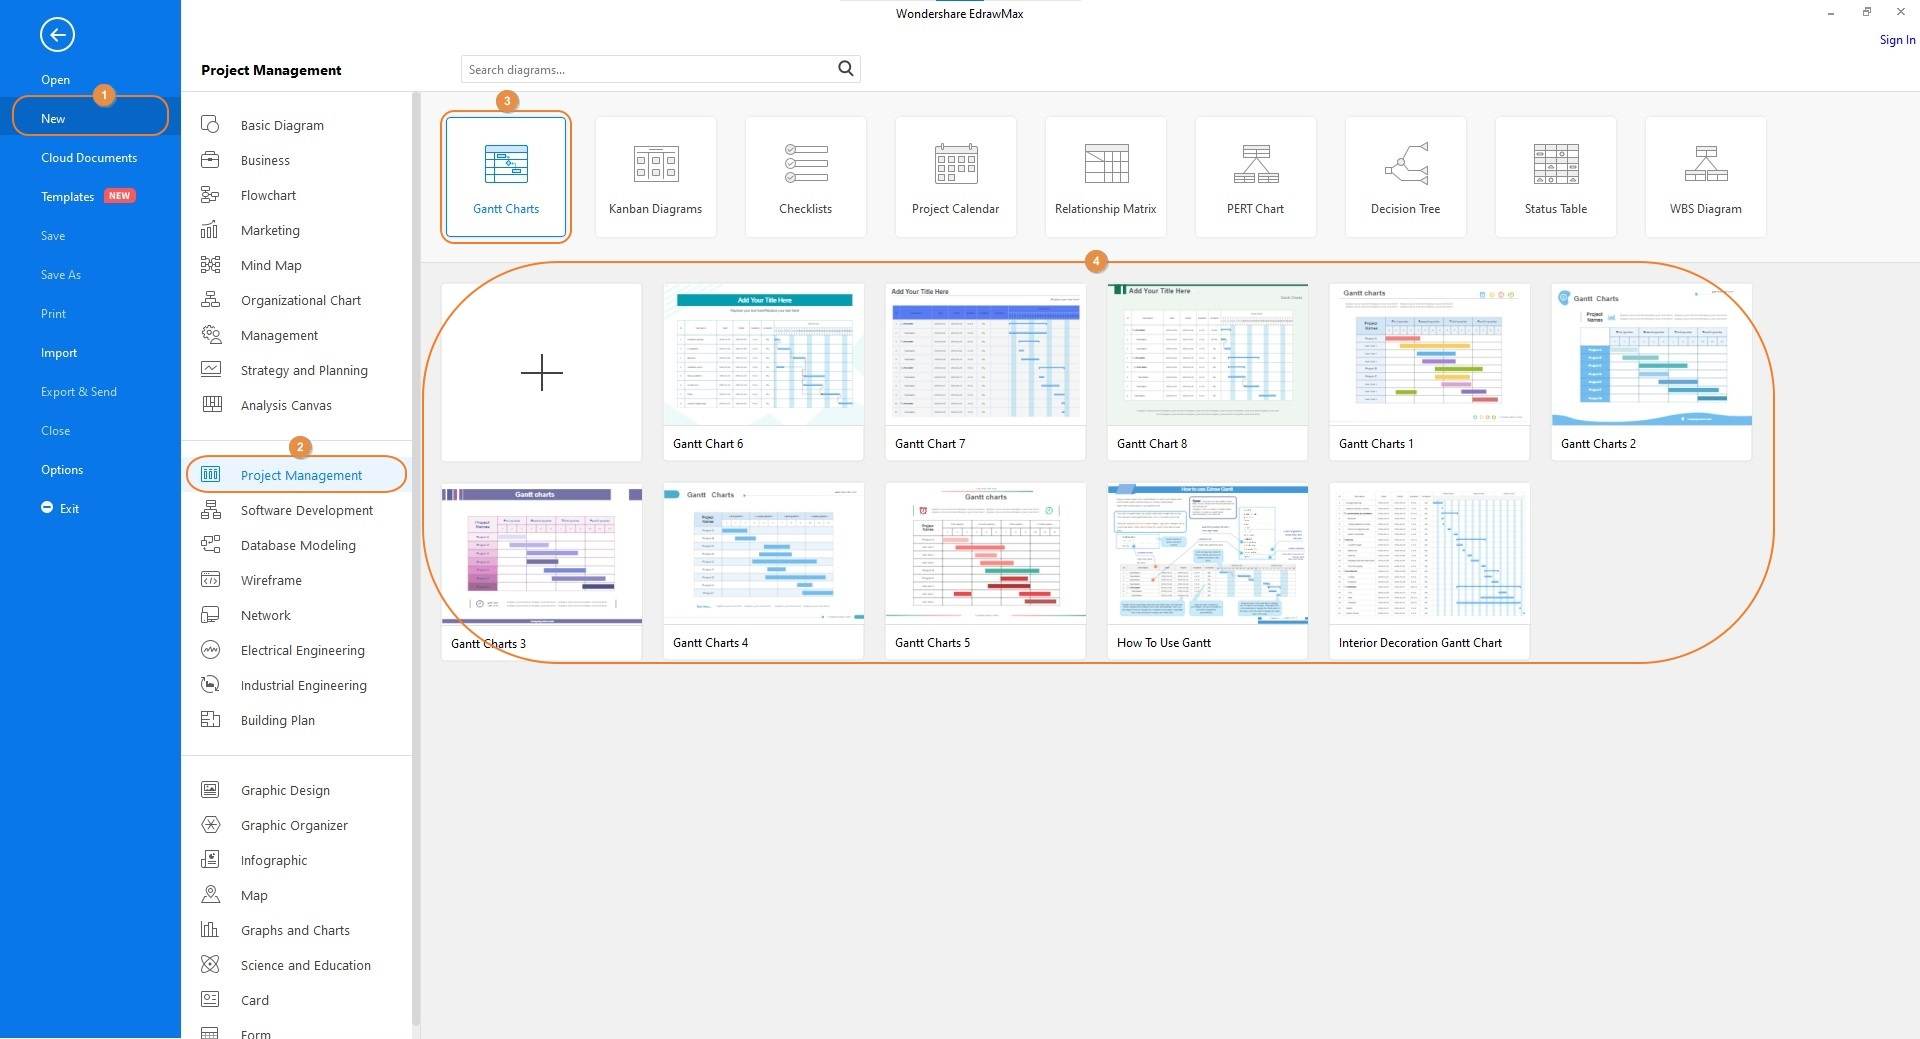
Step 1: Choose a Template to Start a Project
Launch Wondershare EdrawMax on your Mac or Windows computer (a Windows 10 PC is used here for demonstration), on the first interface, confirm that New is selected from the navigation pane on the left, and click to select Project Management from the center pane. From the upper section of the right window, click Gantt Charts, and click the most relevant template according to your project from the lower section.
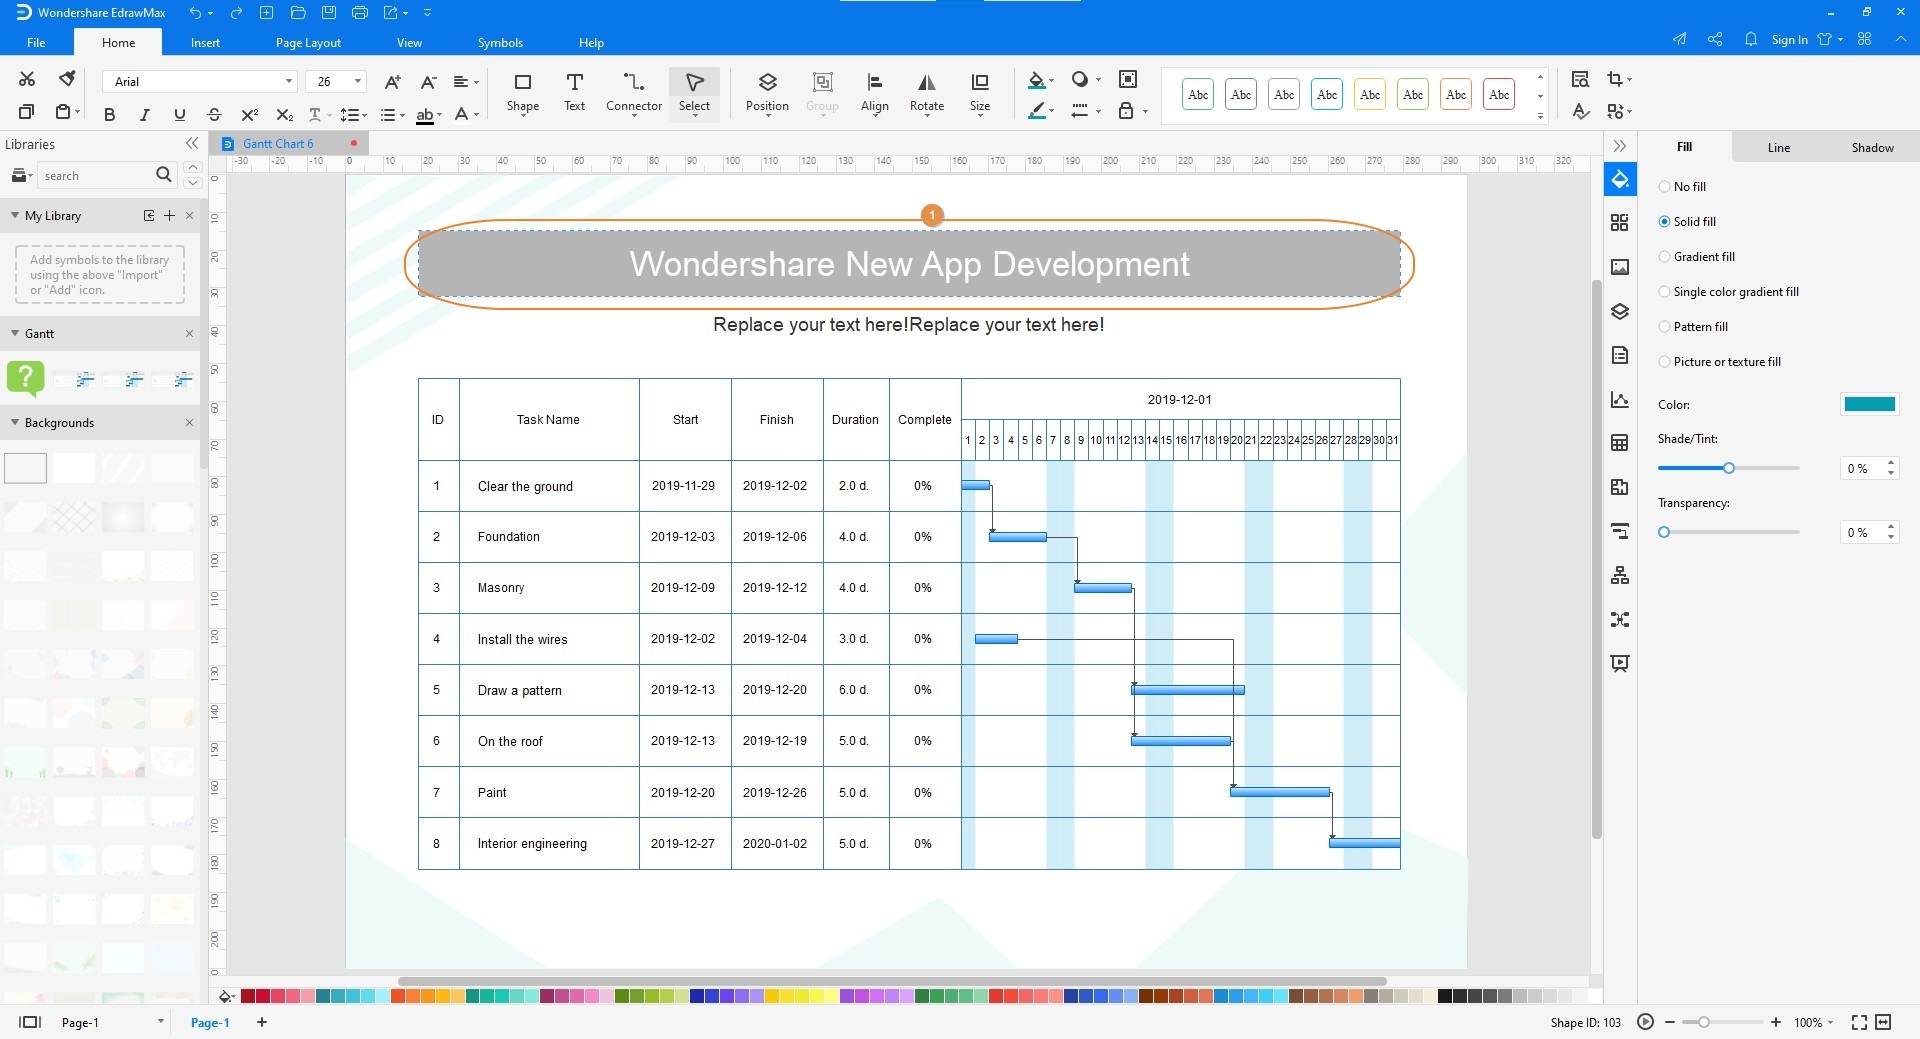
Step 2: Edit the Captions
Double-click the first label, and replace the demo text with the specific caption that you want the object of the Gantt Chart to have. Repeat this process for all the text that the diagram has.
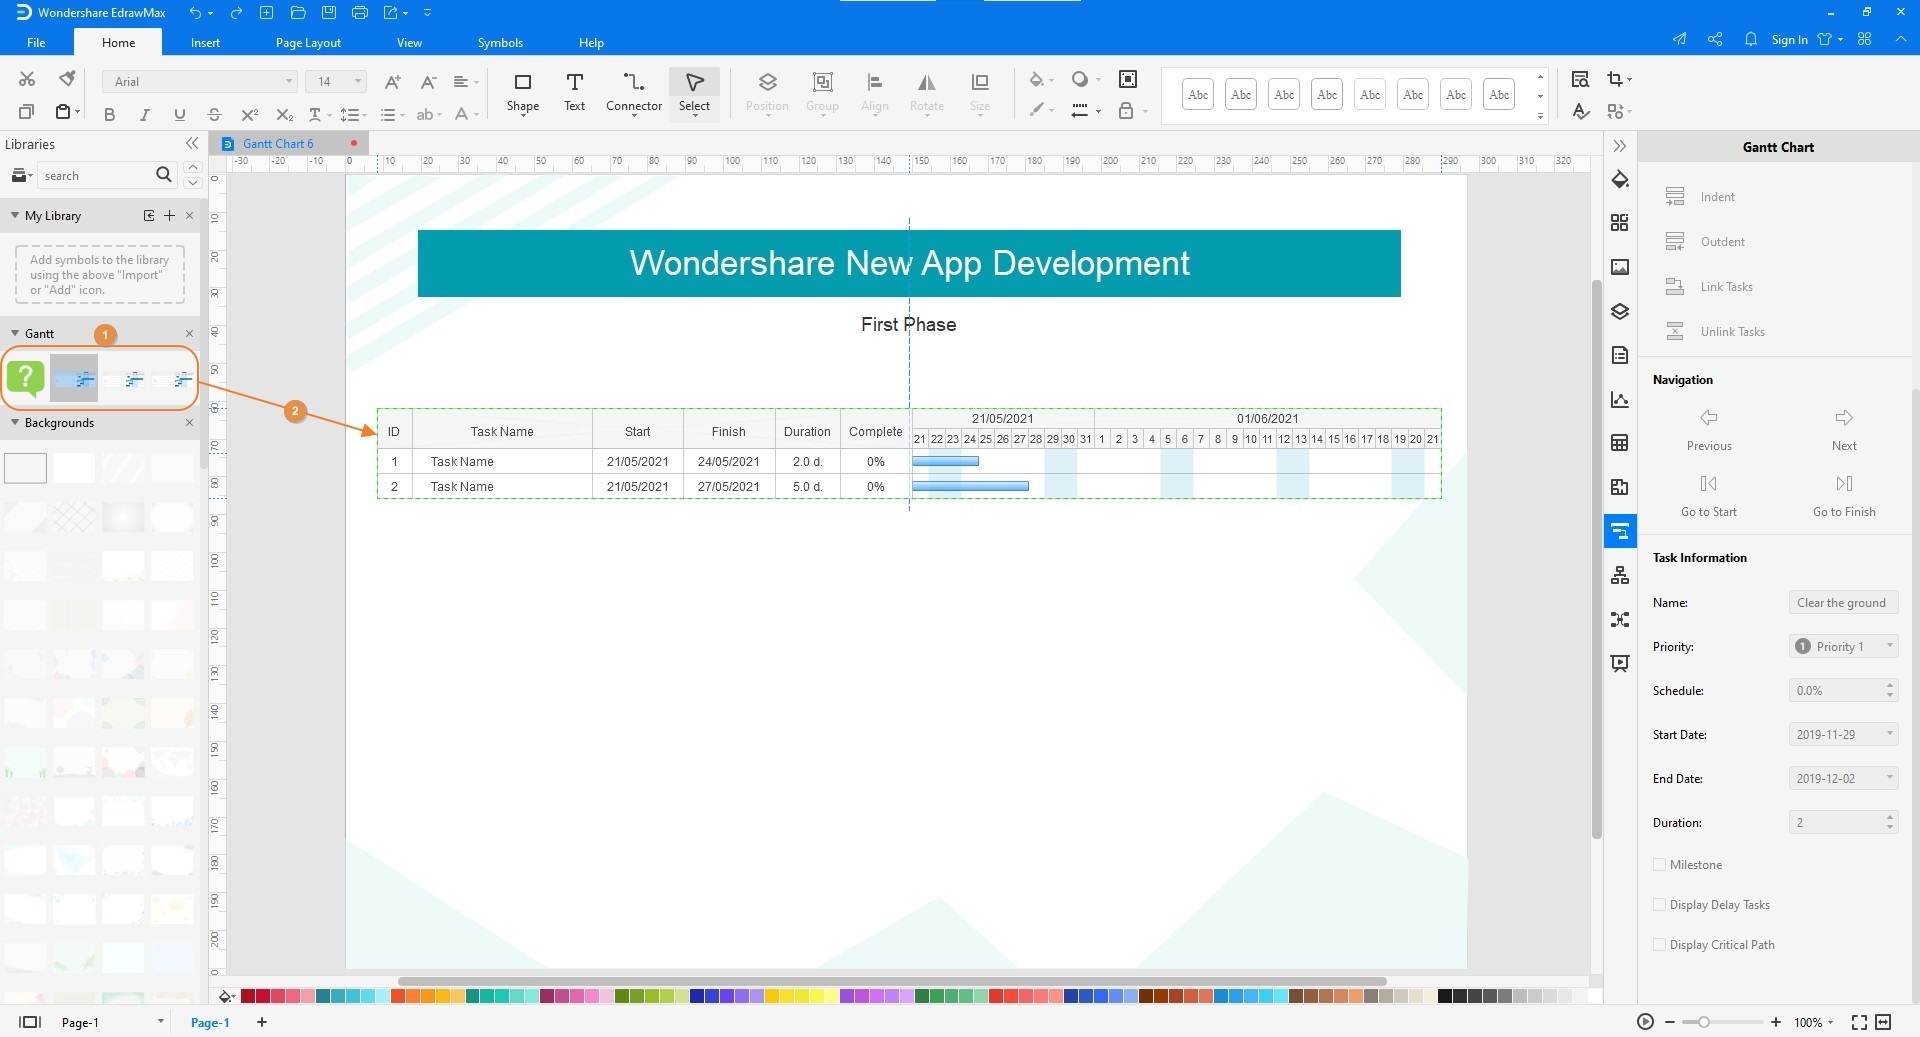
Step 3: Add Your Custom Details
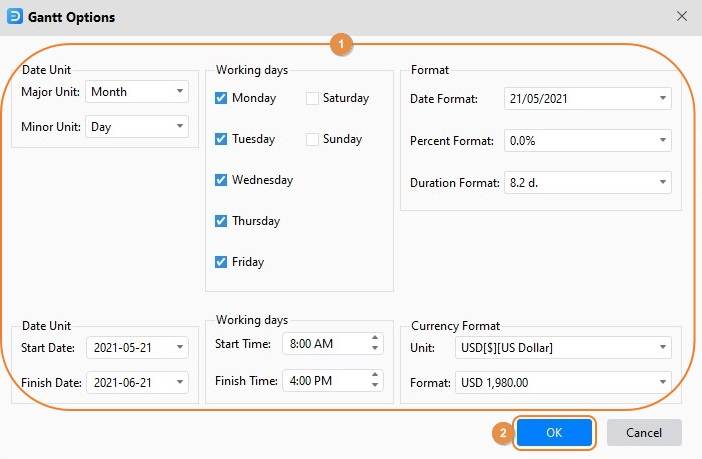
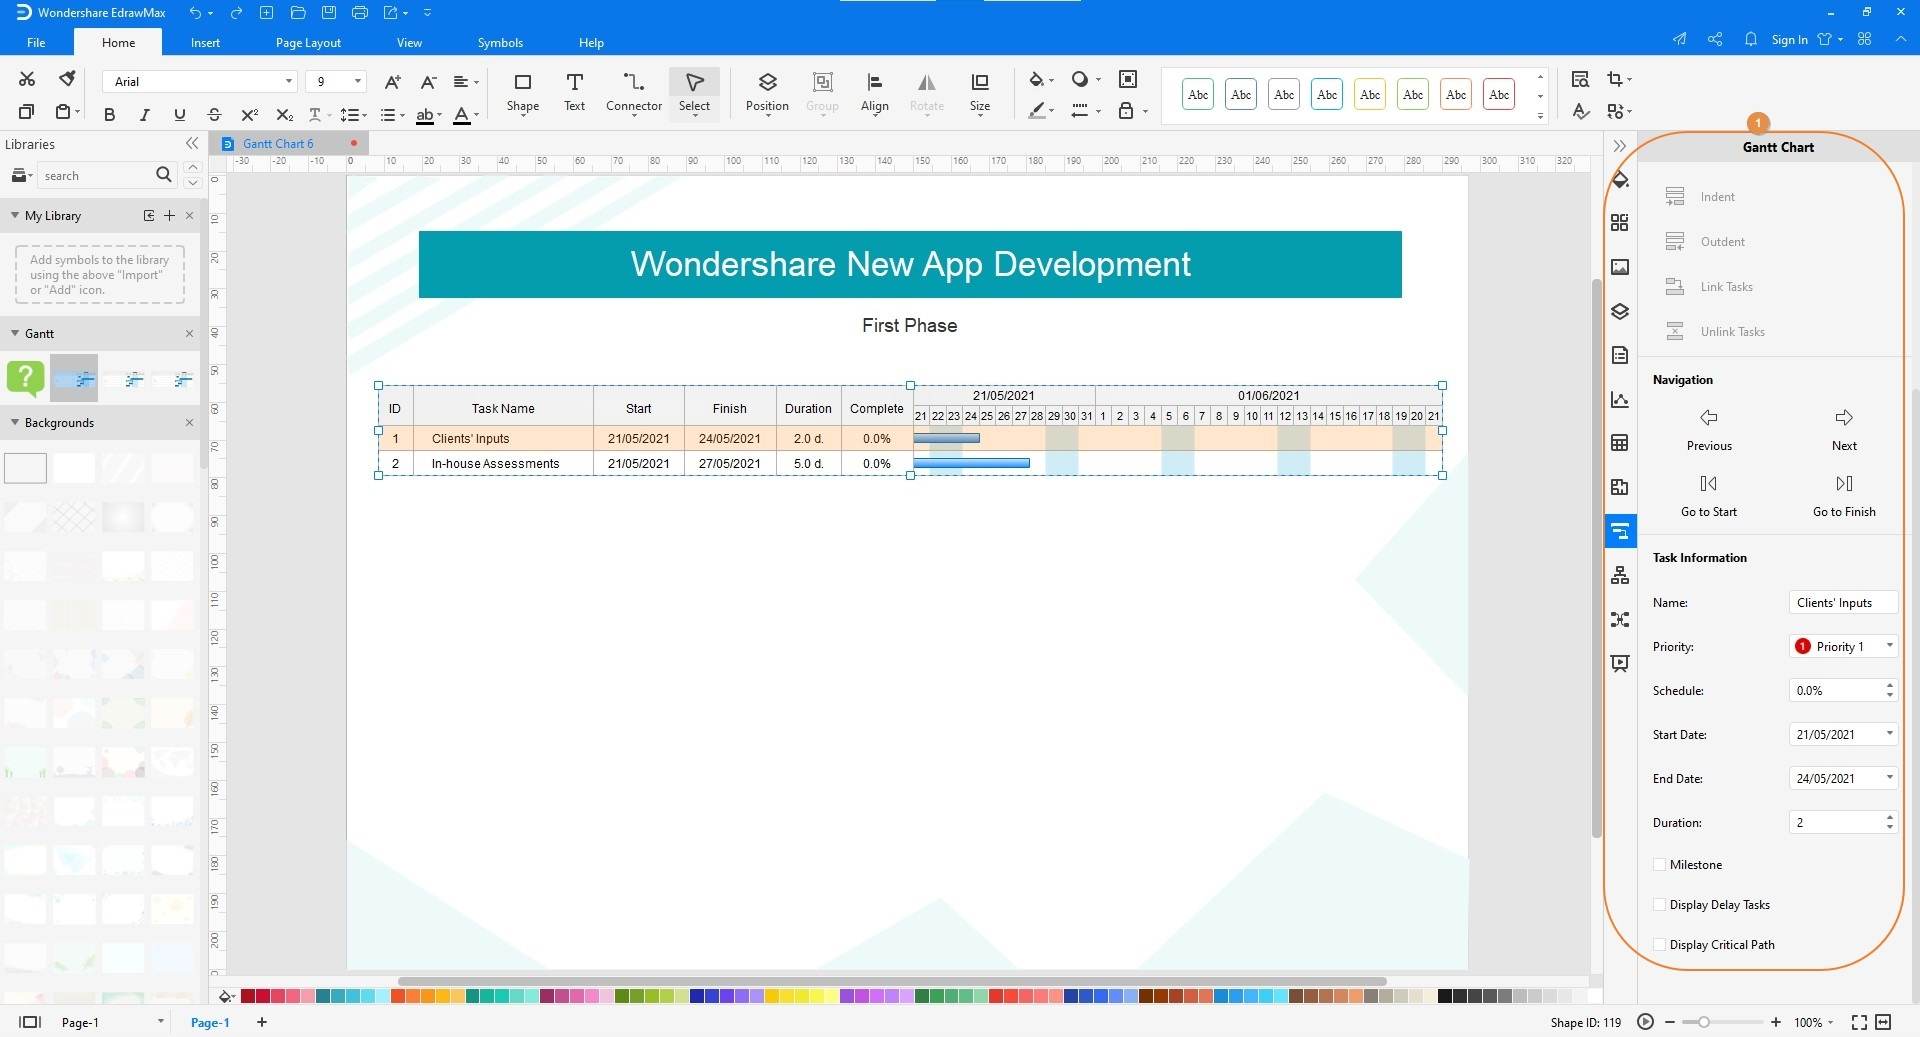
Drag a Gantt from the library on the left to the Canvas. When the Gantt Options box appears, use the available lists and checkboxes to specify the type of information and details that you want to add to the diagram, and click OK. Next, use the method explained above to edit the captions. Further, you can explore and use the advanced tools present in the right pane to make granular adjustments like setting task priority, defining milestones, adding more rows and columns, etc., to the chart.
Step 4: Save and Export
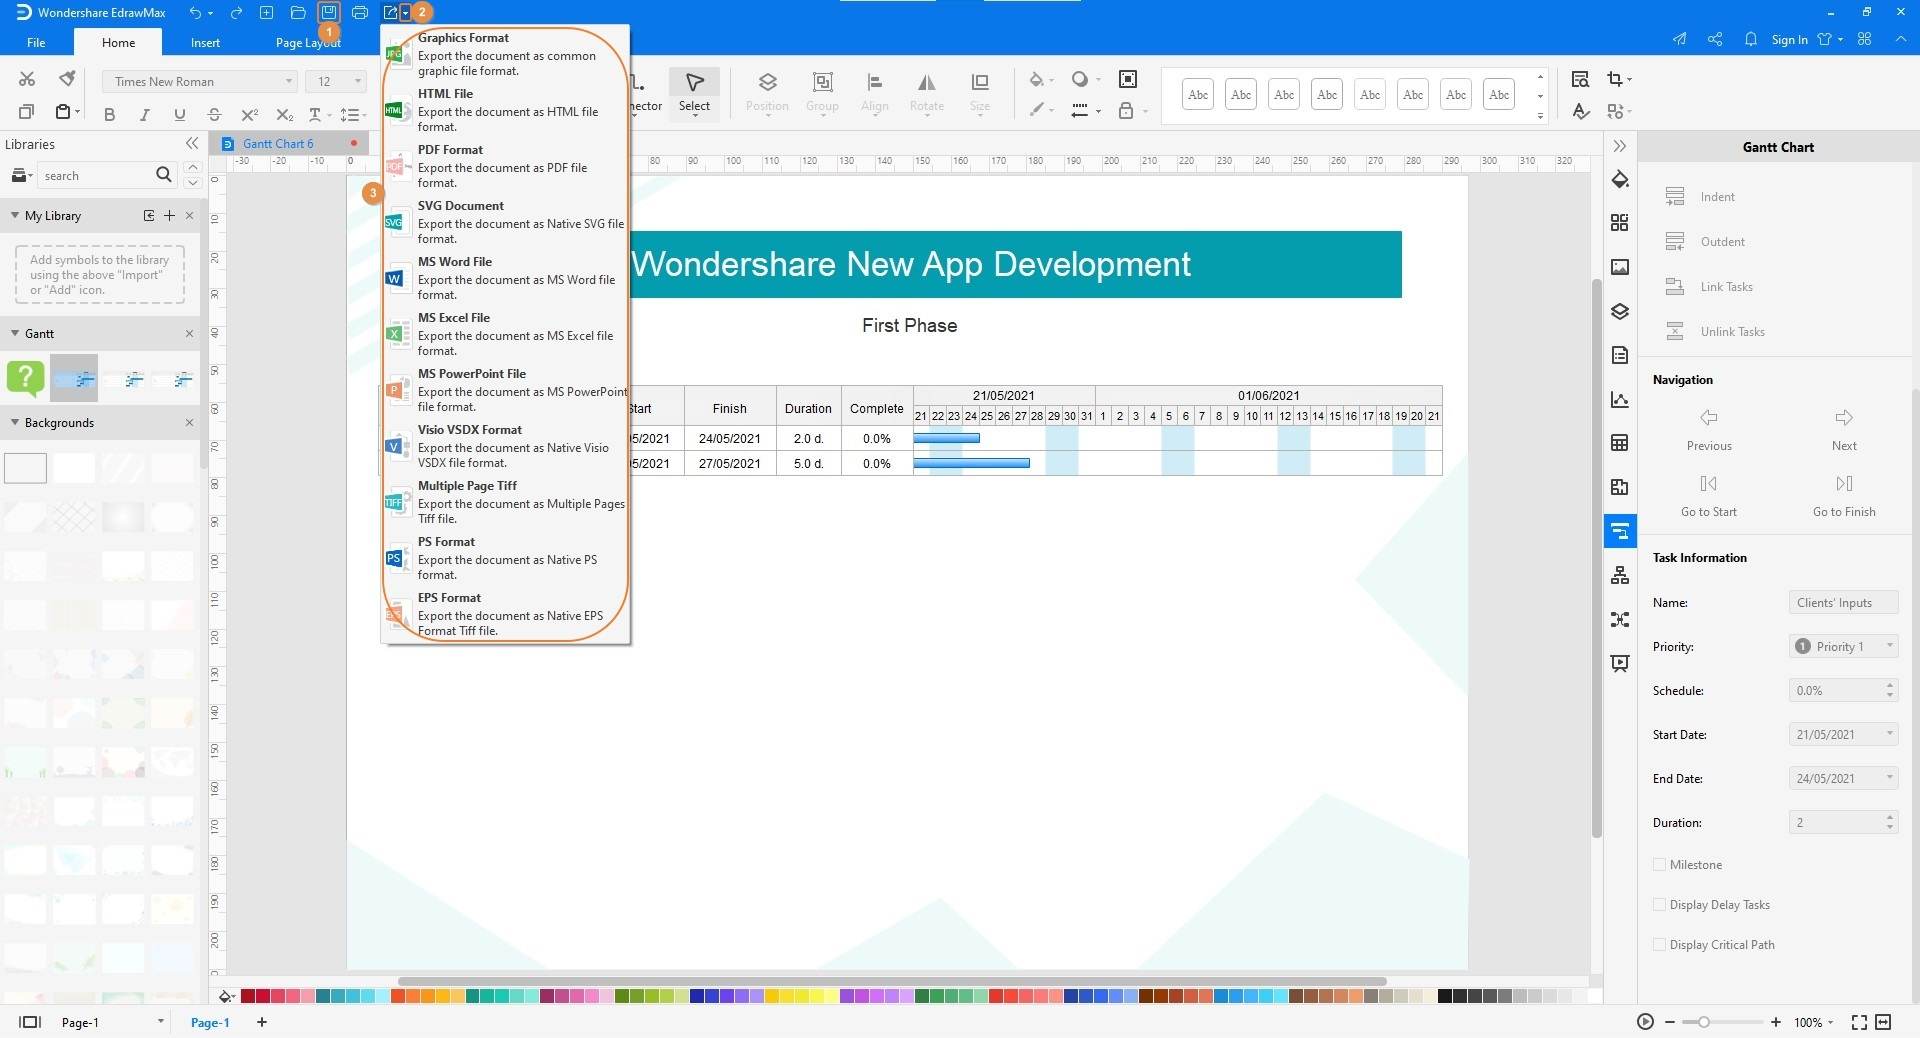
Once you are done creating the Gantt Chart, click the Save icon from the top-right corner. Now, click the More button on the Export icon, and pick your preferred output format for exporting the diagram for further distribution and/or printing from the list that appears.
EdrawMax
All-in-One Diagram Software
- Superior file compatibility: Import and export drawings to various file formats, such as Visio
- Cross-platform supported (Windows, Mac, Linux, Web, Android, iOS)


6: Tips for Making a Gantt Chart
There are a couple of important points that you should remember while preparing a Gantt Chart to make things easier for you. These tips include:
- Have all the ingredients in hand before diving into the Gantt Chart creation process
- Remain in touch with all the personnel involved in the ongoing projects, and do not hesitate to seek inputs from them wherever needed
- Feel free to scale up the Gantt Chart as much as needed. This stands true especially when you have used a computer program to draw a vector-based diagram
- Make sure to use simple and large fonts to make it easy for everyone to read and understand the chart
- Consider using the shades in the Gantt Chart according to the theme color your organization uses. This would make the drawing consistent, and the diagram would look professional when shared with clients for their inputs.
7: Examples of Gantt Charts
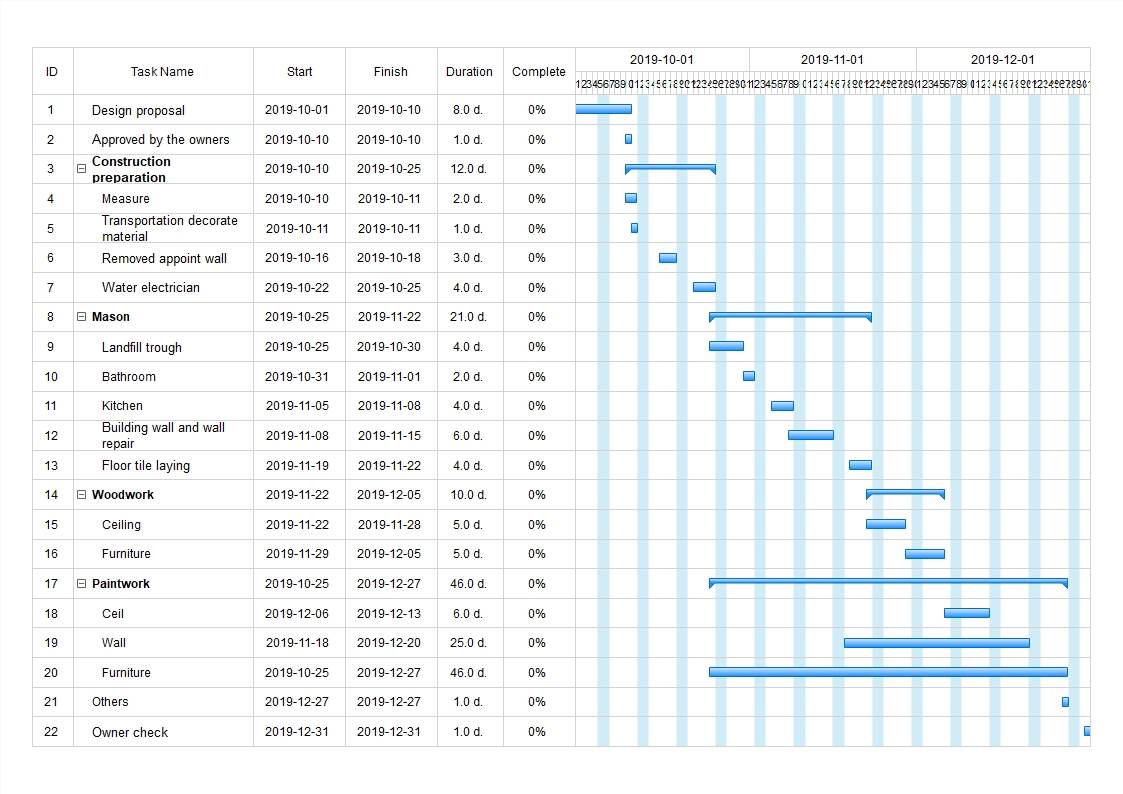
The above Gantt Chart shows the work process of an interior designing project were in the first step, a design proposal is generated and sent to the client for their approval. The second step shows that the client has approved the proposal, and the project is now ready to move to the third phase, where the preparation for construction is to be done. The starting and ending dates, along with the duration and the completion percentage in relation with the entire project is shown in their corresponding fields. The details can also be seen graphically with the help of the horizontal bars that are present on the right side of the table.
8: Conclusion
A Gantt Chart plays a vital role when it comes to monitoring the ongoing projects, and assessing the engagement and availability of the personnel involved in them. It is the Gantt Chart that helps the project managers to efficiently administer the manpower, and see when more people must be hired to expedite the process.
When it comes to preparing a Gantt Chart, things can be done either manually, or using an efficient PC program such as Wondershare EdrawMax that helps you to produce an error-free illustration. Such a diagram can also be scaled up to infinite times for clear visualization without deteriorating the picture quality whatsoever.

