Program Flowchart, PAD Diagram and NS Diagram
Program Flowchart
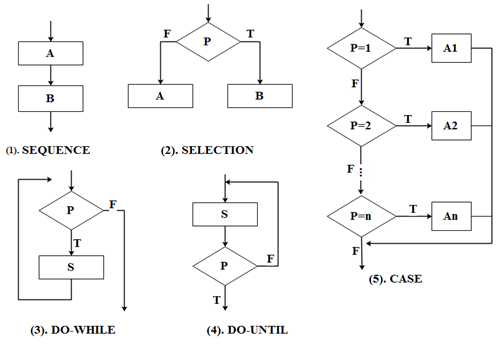
A program flowchart depicts visually via symbols and lines the logic flow of a program and the interactions it performs. It is independent of any programming language, more intuitive, clearer and easier to learn. But it also has some serious limitations. For example, the symbols are usually not standardized and are often selected by users according to their habitual usage. In particular, the arrow shapes representing program control flow are not constrained in any way, meaning they can be free transferred of control. These obviously deviate from requirements of software engineering. To eliminate these shortcomings, symbols used for program flowcharts should be designated strictly, not allowing people to draw program flowcharts lack of standardization. For instance, it ought to be standardized that only the 5 basic control structures can be applied so that program flowcharts can depict structured programs.
Figure 1 Basic Control Structure of Flowchart
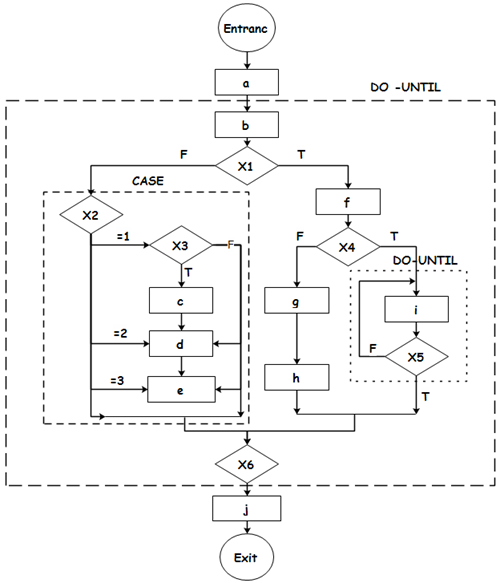
Any complicated program flowchart should be composed of or nested by these 5 basic control structures so that both business and technical users can have a common understanding of how the program works and fits together. There are some dashes boxes added in the diagram so as to make the nested relation of control structure easier to understand. Apparently, the program depicted by this flowchart is structured.
Figure 2 Complicated Program Flowchart Example
N-S Diagram
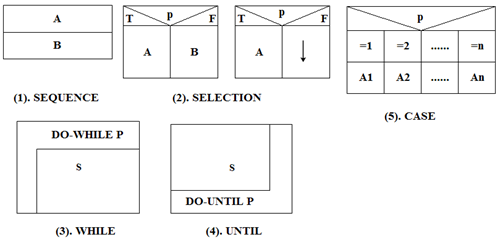
Nassi and Shneiderman proposed a diagram description tool in line with the principles of structured programming, called N-S diagram in short, Box Diagram or Structogram since it shows a program's structure. N-S diagram specifies 5 graphic components to represent the five basic control structures. Please refer to Figure 3.
Figure 3 Five Basic Control Structures of N-S Diagram
To illustrate the usage of N-S diagram, the example in Figure 2 is applied to sketch the program via the N-S diagram in Figure 4.
Figure 4 An N-S Diagram Example
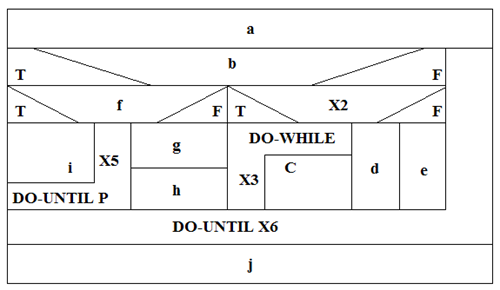
As stated above, any N-S diagram is the combination and nesting of the five basic control structures introduced before. Following a top-down flow, it sketches the whole process into smaller and smaller subprocesses. In the case of extremely complex program, the N-S diagram can be quite large.
PAD Diagram
PAD is short for Problem Analysis Diagram, which is put forward by Japan' Hitachi. Evolved from program flowchart, it is a diagramming tool deploying structured design ideas to present logic structure of programs. It has already been acknowledged by ISO currently. PAD has also set five basic control structure schemas, allowing recursive use.
Figure 5 Basic Control Structures of PAD

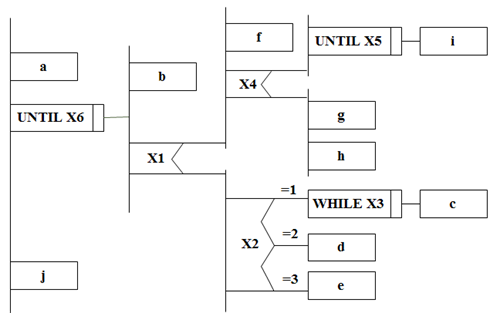
As a PAD application example, Figure shows the PAD representation of the structure in Figure . The program's layer relationship indicated by PAD is laid out by vertical lines with every vertical line marking one layer. From left to right, PAD unfolds the program one layer after another and thus turns the problem into a clear and organized visualization.
Starting from the junction on the upper end of the left main trunk, PAD performs from top to bottom in sequence. Each time when coming across a loop or decision process, it will move into the next layer from left to right, starting to perform from the first left main line that stands for the next layer until the bottom end of the line then returning to the transfer point of the upper layer's line. It keeps unfolding in this way until the bottom end of the main line.
Figure 6 PAD Example
More Related Articles
Top 15 Funny Flowchart Examples
Basic Flowchart Templates and Examples

