Create Fishbone Diagram for PPT
What is Fishbone Diagram?
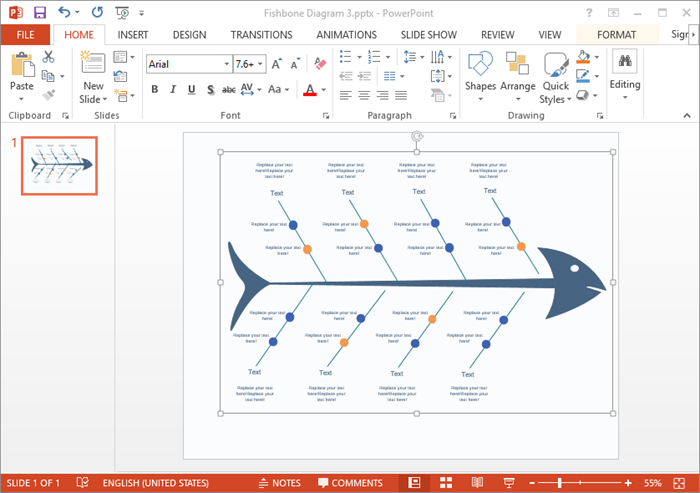
Fishbone diagram is actually a metaphorical saying of cause-and-effect diagram. A fishbone diagram is a visualized tool for categorizing the potential causes of a problem to identify the root causes, and helps employees avoid solutions that merely address the symptoms of a much larger problem. No matter in meetings, group discussions or presentations, a fishbone diagram gives you a leg up in getting organized and better prepared to analyze a problem clearly.
How to Create Fishbone Diagrams for PPT
1. On the File menu, click New, click Business Diagram, and double click Fishbone template. A new drawing page will open.
2. Go to the library pane on the left of the canvas. From the library of Cause and Effect Diagram, drag fishbone shapes onto the canvas.
3. When you connect shapes, there are auto connection points which will glue the shapes together.
- To label a category, use the Text tool and then type your words.
- To delete a category, select the shape and then press the Delete key
4. To represent major causes contributing to the categories, drag Primary cause shapes onto the drawing page and snap the arrowheads to category lines.
5. To represent secondary causes contributing to primary causes, drag Secondary cause shapes onto the drawing page and snap the arrowheads to primary cause lines.

Download Fishbone Diagram Software:
Export Fishbone Diagram to MS Office PPT
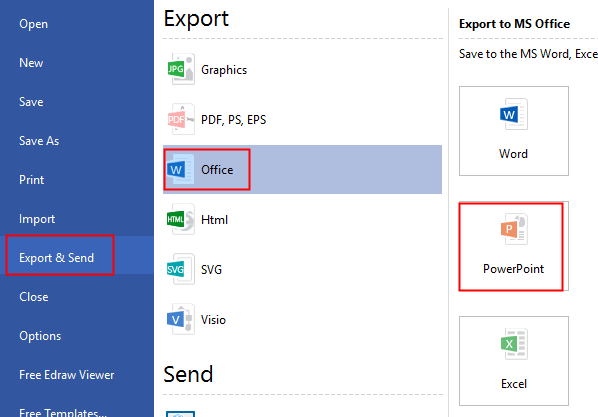
Edraw offers support for exporting your diagram to various formats in one click, including Microsoft Office, PDF, and many other graphic formats. On the File menu, click Export and Send for Export options.
To save or export file to Word, do one of the following:
- Click Save, choose saving type as Word Format (.docx) from the drop down menu.
- Click Export to Office, and choose MS Word File, then save it.

Related Articles
How to Create Fishbone Diagram for Word

