Using Fishbone Diagrams for Cause Analysis
Fishbone diagram is a simple tool that allows quick and effective root causes to be understood, in the pursuit of corrective actions. It assists us to focus on the events, processes and activities, identify possible causes of a problem and sort ideas into useful categories, therefore, it is a visual tool to look at cause and effect.
Introduction to Fishbone Diagram
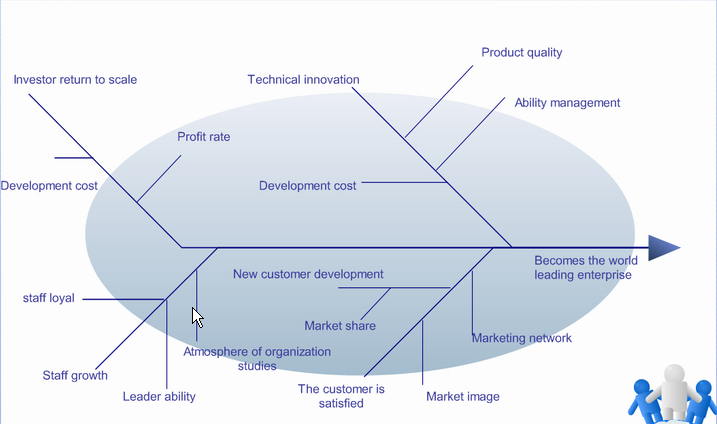
The fishbone diagram is the brainchild of Kaoru Ishikawa, who pioneered quality management processes in the Kawasaki shipyards, and in the process became one of the founding fathers of modern management. The fishbone diagram is used to explore all the potential or real causes (or inputs) that result in a single effect (or output). Causes are arranged according to their level of importance or detail, resulting in a depiction of relationships and hierarchy of events. This can help you search for root causes, identify areas where there may be problems, and compare the relative importance of different causes.
Two Concepts in Cause Analysis
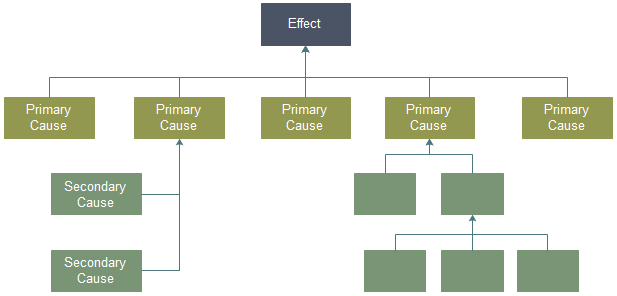
When a cause and effect diagram is used to represent causality, then the primary and secondary branches have specific meanings.
A Primary Cause is one that could lead directly to the effect. For example, a glass that was prematurely leaked water might be caused by a sudden jarring motion such as dropping, which might be listed under the category People if it was associated with handling by a person.
A Secondary Cause is a cause that could lead to a Primary Cause, but does not directly cause the end effect. For example, the cause slippery hands doesn't make the glass leak water, but it could lead to the glass being dropped. So slippery hands would be listed as a secondary cause under dropping.
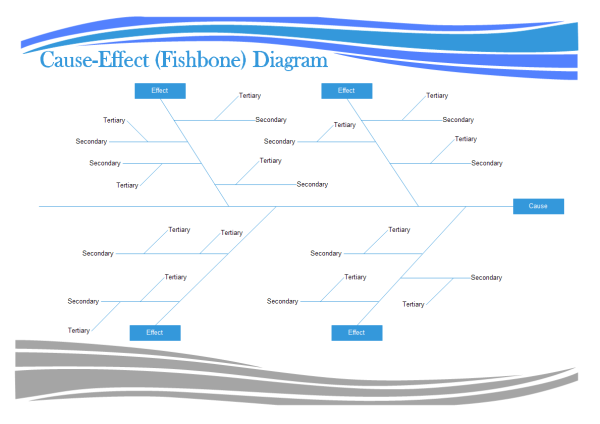
The fishbone diagram approach to cause and effect analysis uses a standard diagram to encourage brainstorming and visually present findings. Causes in a fishbone diagram are frequently arranged into four major categories. While these categories can be anything, you will often see:
1. manpower, methods, materials, and machinery (recommended for manufacturing)
2. equipment, policies, procedures, and people (recommended for administration and service).
When you successfully make a fishbone diagram, it is possible to analyze findings together, and to determine the most important factors involved in either solving a problem or achieving success.
Plan for the Future via Cause Analysis
While cause analysis is typically used to understand what has happened (usually in order to avoid having it happen again), it can also be used to help plan for the future. How? Rather than attempting to explain an existing outcome, it is possible to set up a hoped-for outcome, and then analyze the elements required to bring the outcome about.
Once you have a clear idea of what's needed, it's much easier to create a plan of action that is likely to succeed. Because the process of analysis involves breaking down the whole into a set of individual parts, you can also use the chart created through Cause and Effect Analysis to determine who should take responsibility for which aspects of the project. If you spent a good deal of time on the process, you may even have the start of a to-do list for various members of the project team.
Like any other business tool, cause analysis is just as effective as the people involved in the process. It's easy to do a poor job of identifying the problem and the causes - and if the first part of the process is done incorrectly, the outcomes will be less useful. That's why it's critical to have a leader who is familiar with the process, and why it's so important that the people involved with the analysis fully understand the problem and can think realistically about solutions.
Five Basic Steps to Using Cause Analysis
1. Define the Effect: Be specific.
2. Choose Categories: The template is set up with the most common set of categories, but you can add or remove categories based on your specific case. See the example categories below.
3. Brainstorm Possible Causes: Using the diagram while brainstorming can both broaden and focus your thinking as you consider the various categories in turn.
4. Ask Why?: You really want to find the root causes, and one way to help do that is to use the 5 Whys technique.
Asking "Why?" or "Why else?" over and over until you come up with possible root causes. "Improper handling" is not a root cause, while "Failing to wear Latex gloves" might be closer to a root cause. But, you could still ask "Why was he/she not wearing gloves?" with the possible response "There were none available." It is a lot easier to take action against the inventory problem than just the generic "improper handling".
5. Investigate: Now that you've come up with possible causes, it is time to go gather data to confirm which causes are real or not.
Tips to Draw Fishbone Diagram:
1. Use the fishbone diagram tool to keep the team focused on the causes of the problem, rather than the symptoms.
2. Consider drawing your fish on a flip chart or large dry erase board.
3. Make sure to leave enough space between the major categories on the diagram so that you can add minor detailed causes later.
4. When you are brainstorming causes, consider having team members write each cause on sticky notes, going around the group asking each person for one cause. Continue going through the rounds, getting more causes, until all ideas are exhausted.


