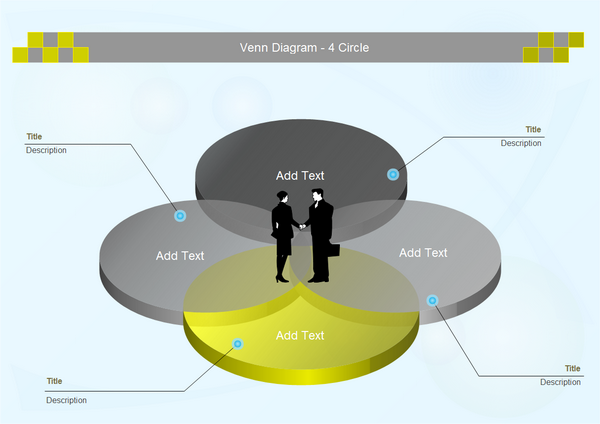
Venn Examples - 4 Circles
Venn diagrams is useful in any situation requires a comparison of two or more entities. It helps you see how much things are in common. A Venn diagram is constructed with a collection of simple closed curves, especially circles, whose edges overlap. Each circle represents a group or entity. You can fill the circles with different colors, but need to be with high transparency, in order to identify the overlap area. In Edraw, you can find many templates of Venn chart both with colors or not. By using the pre-drawn template and shapes, you can easily and quickly create a good looking Venn chart.

Please click here to free download Edraw Charting Software to use the built-in templates to create and present Venn charts in minutes.
Related Diagrams

|

|

|
| Venn chart with 3 circles | Relative Diagram | Venn Analysis Chart |

