Line Chart Examples - Comparison
Posted by
James Freeman
|
An example line chart, showing product sales trends over time. It's ideal for comparing yearly trends for different time intervals.
An example line chart shows product sales trends over time. It's ideal for comparing yearly trends for different time intervals.

Click here to free download Edraw Charting Software so that you can use the built-in template and line chart symbols to create and present line charts in minutes.
Related Diagrams
|
|
|
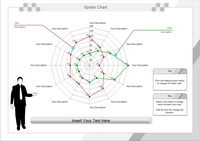
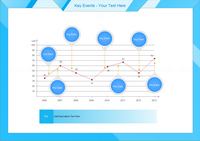
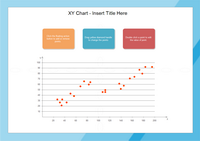
| Spider Chart | Key Event | XY Chart |

