テンプレートコミュニティ /
Scatter Plot of Weak Positive Correlation
Scatter Plot of Weak Positive Correlation
Joy
に公開されました 2021-09-22
オンラインで編集
AIでダイアグラムを生成
ダウンロード
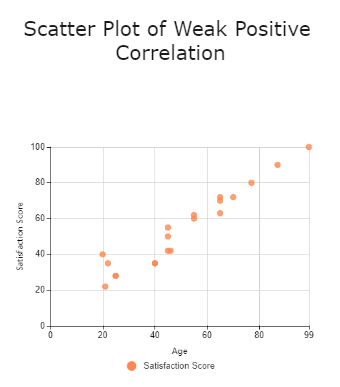
A scatter plot, commonly known as a scatter graph or scatter chart, uses dots to represent values for different numeric variables. To show a weak positive correlation, one can see that the value of Y increases slightly as the value of X increases.
Tag
scatter graph
シェア
コメントを追加
投稿
おすすめ
テンプレート
読み込み中
Close
Close