How to Create a Pyramid Chart
Part 1: What is Pyramind Diagram?
Pyramid diagrams organise information in a hierarchical manner. As the name suggests, the overall diagram is shaped as a triangle, with lines dividing it into different sections. The sections are sized differently, and information can be placed in them in order of importance or size. The most commonly seen pyramid diagrams are food charts, with the least healthy foods placed at the top, and the healthiest foods at the bottom.
A pyramid diagram is one of the best ways to help visualise the importance of a set of information. This method of presentation is beneficial to students and professionals alike, and can facilitate data analysis.
Part 2: How to Make a Pyramind Diagram Effortlessly?
Step 1: Start EdrawMax.
Step 2: Navigate to [New]>[Marketing]>[Pyramid Diagrams]
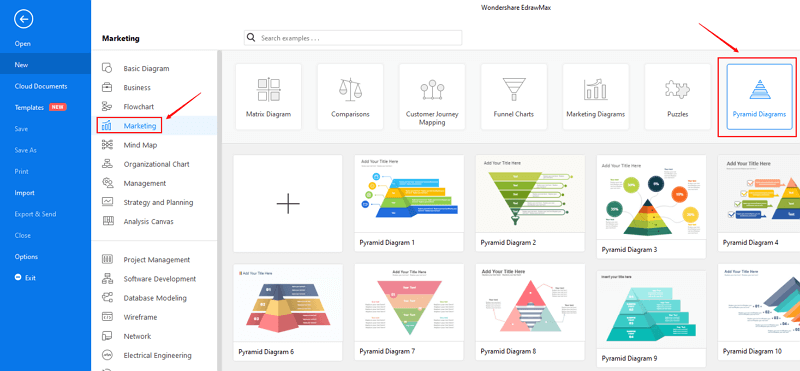
Step 3: Select one pyramid diagram template to edit on it or click the [+] sign to start from scratch.
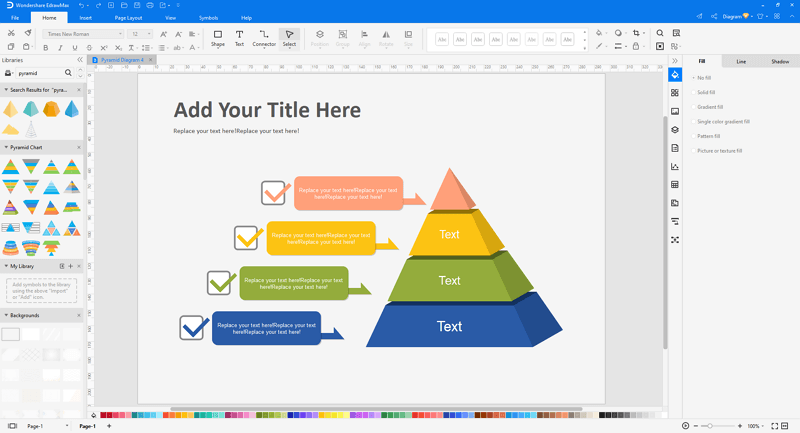
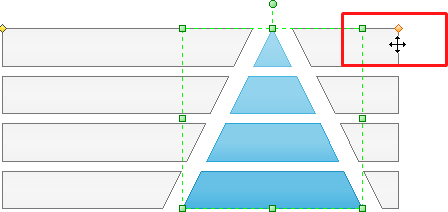
Note: EdrawMax has many functions for creating pyramid diagrams.
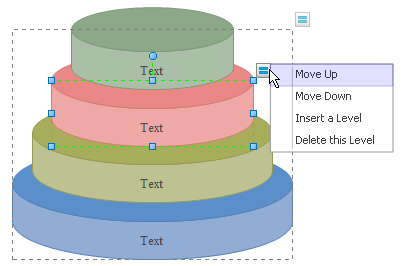
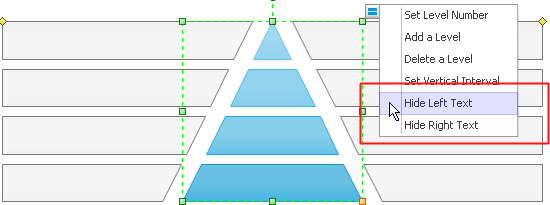
Step 4: You can export the file to Graphics, PDF, editable MS Office file, SVG and Visio vsdx file.

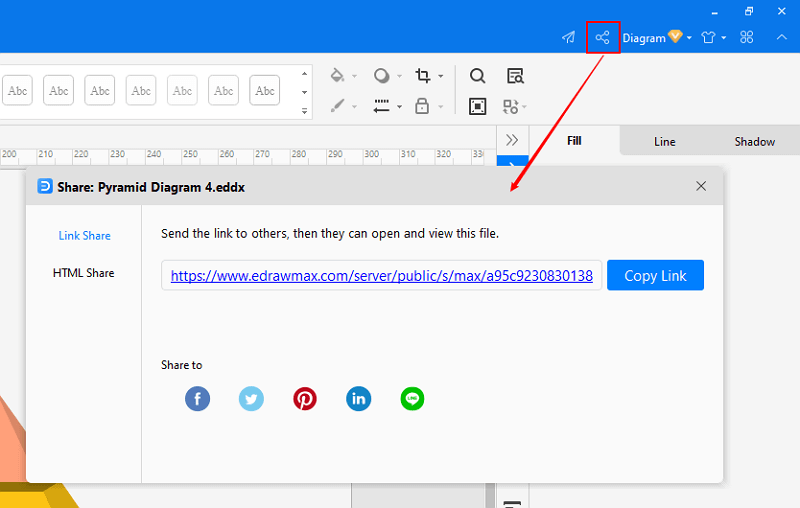
Step 5: And you can share your diagram with others via social media and online website page.
Part 3: Pyramind Diagram Examples
Example 1: Pyramid Diagram 1
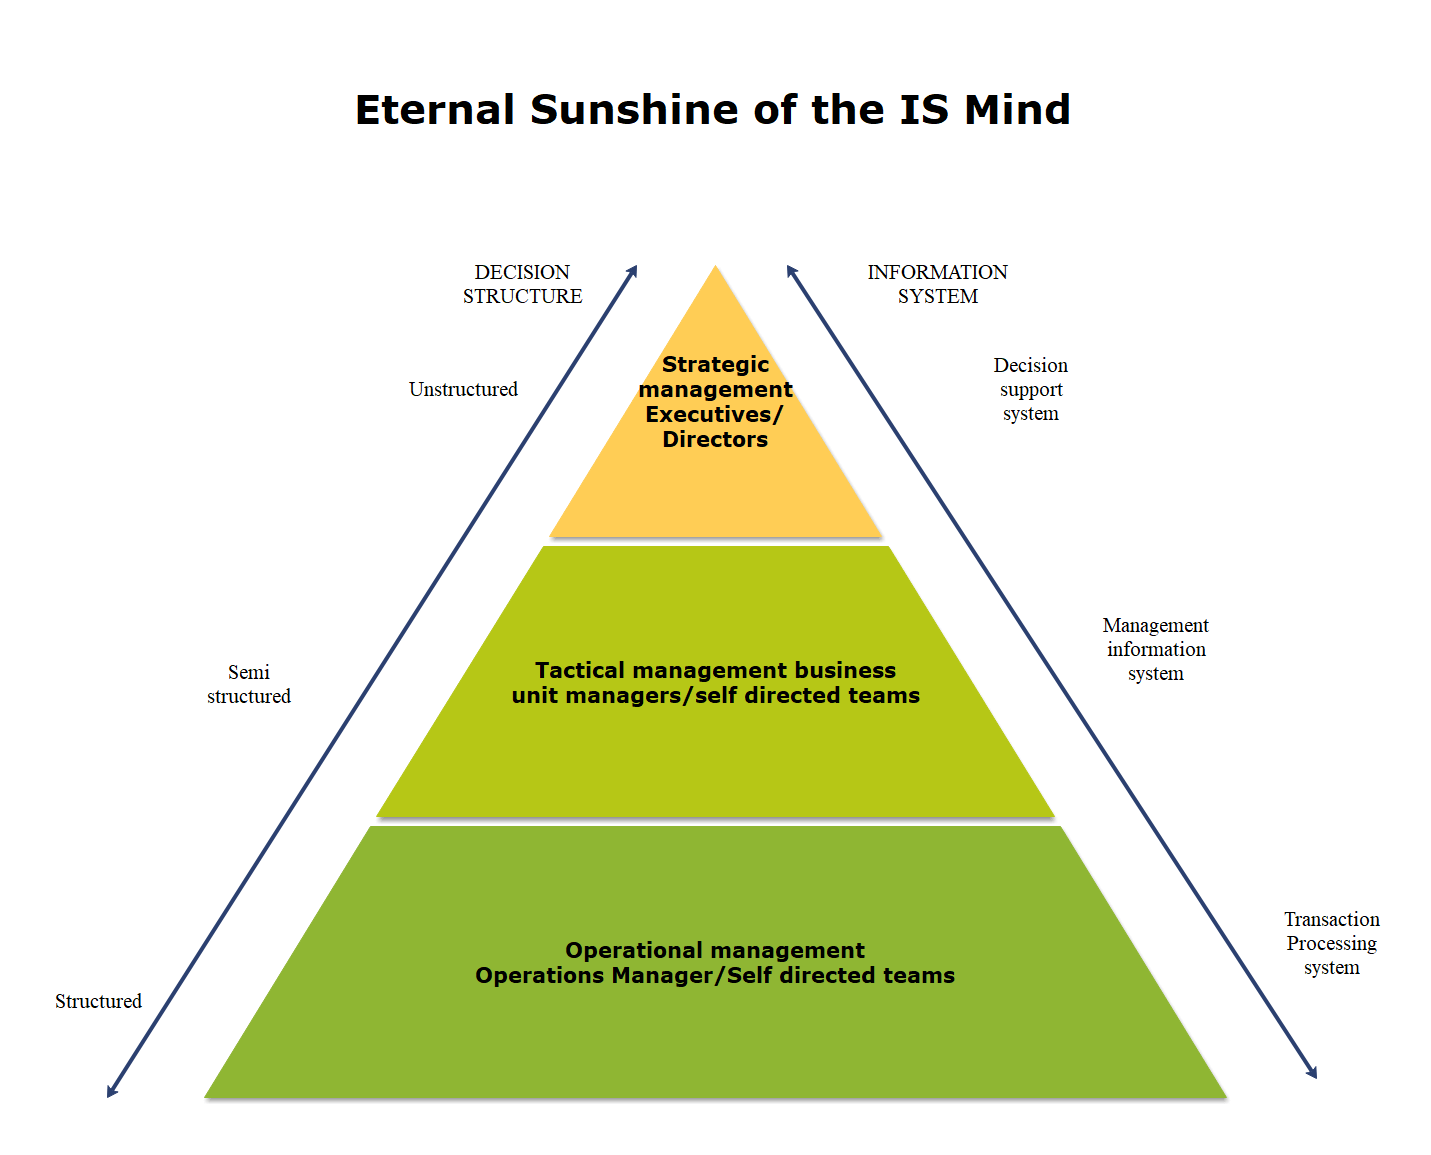
The pyramid diagram template visualizes data in hierarchical structure from base-upward. There is an ideal useful presentation to depict the flow of information in any organization. The study of Information systems is mainly about studying what a business needs to make a profit and what sort of technology they will require to achieve the set goals under the given deadline.
Example 2: Pyramid Diagram 2
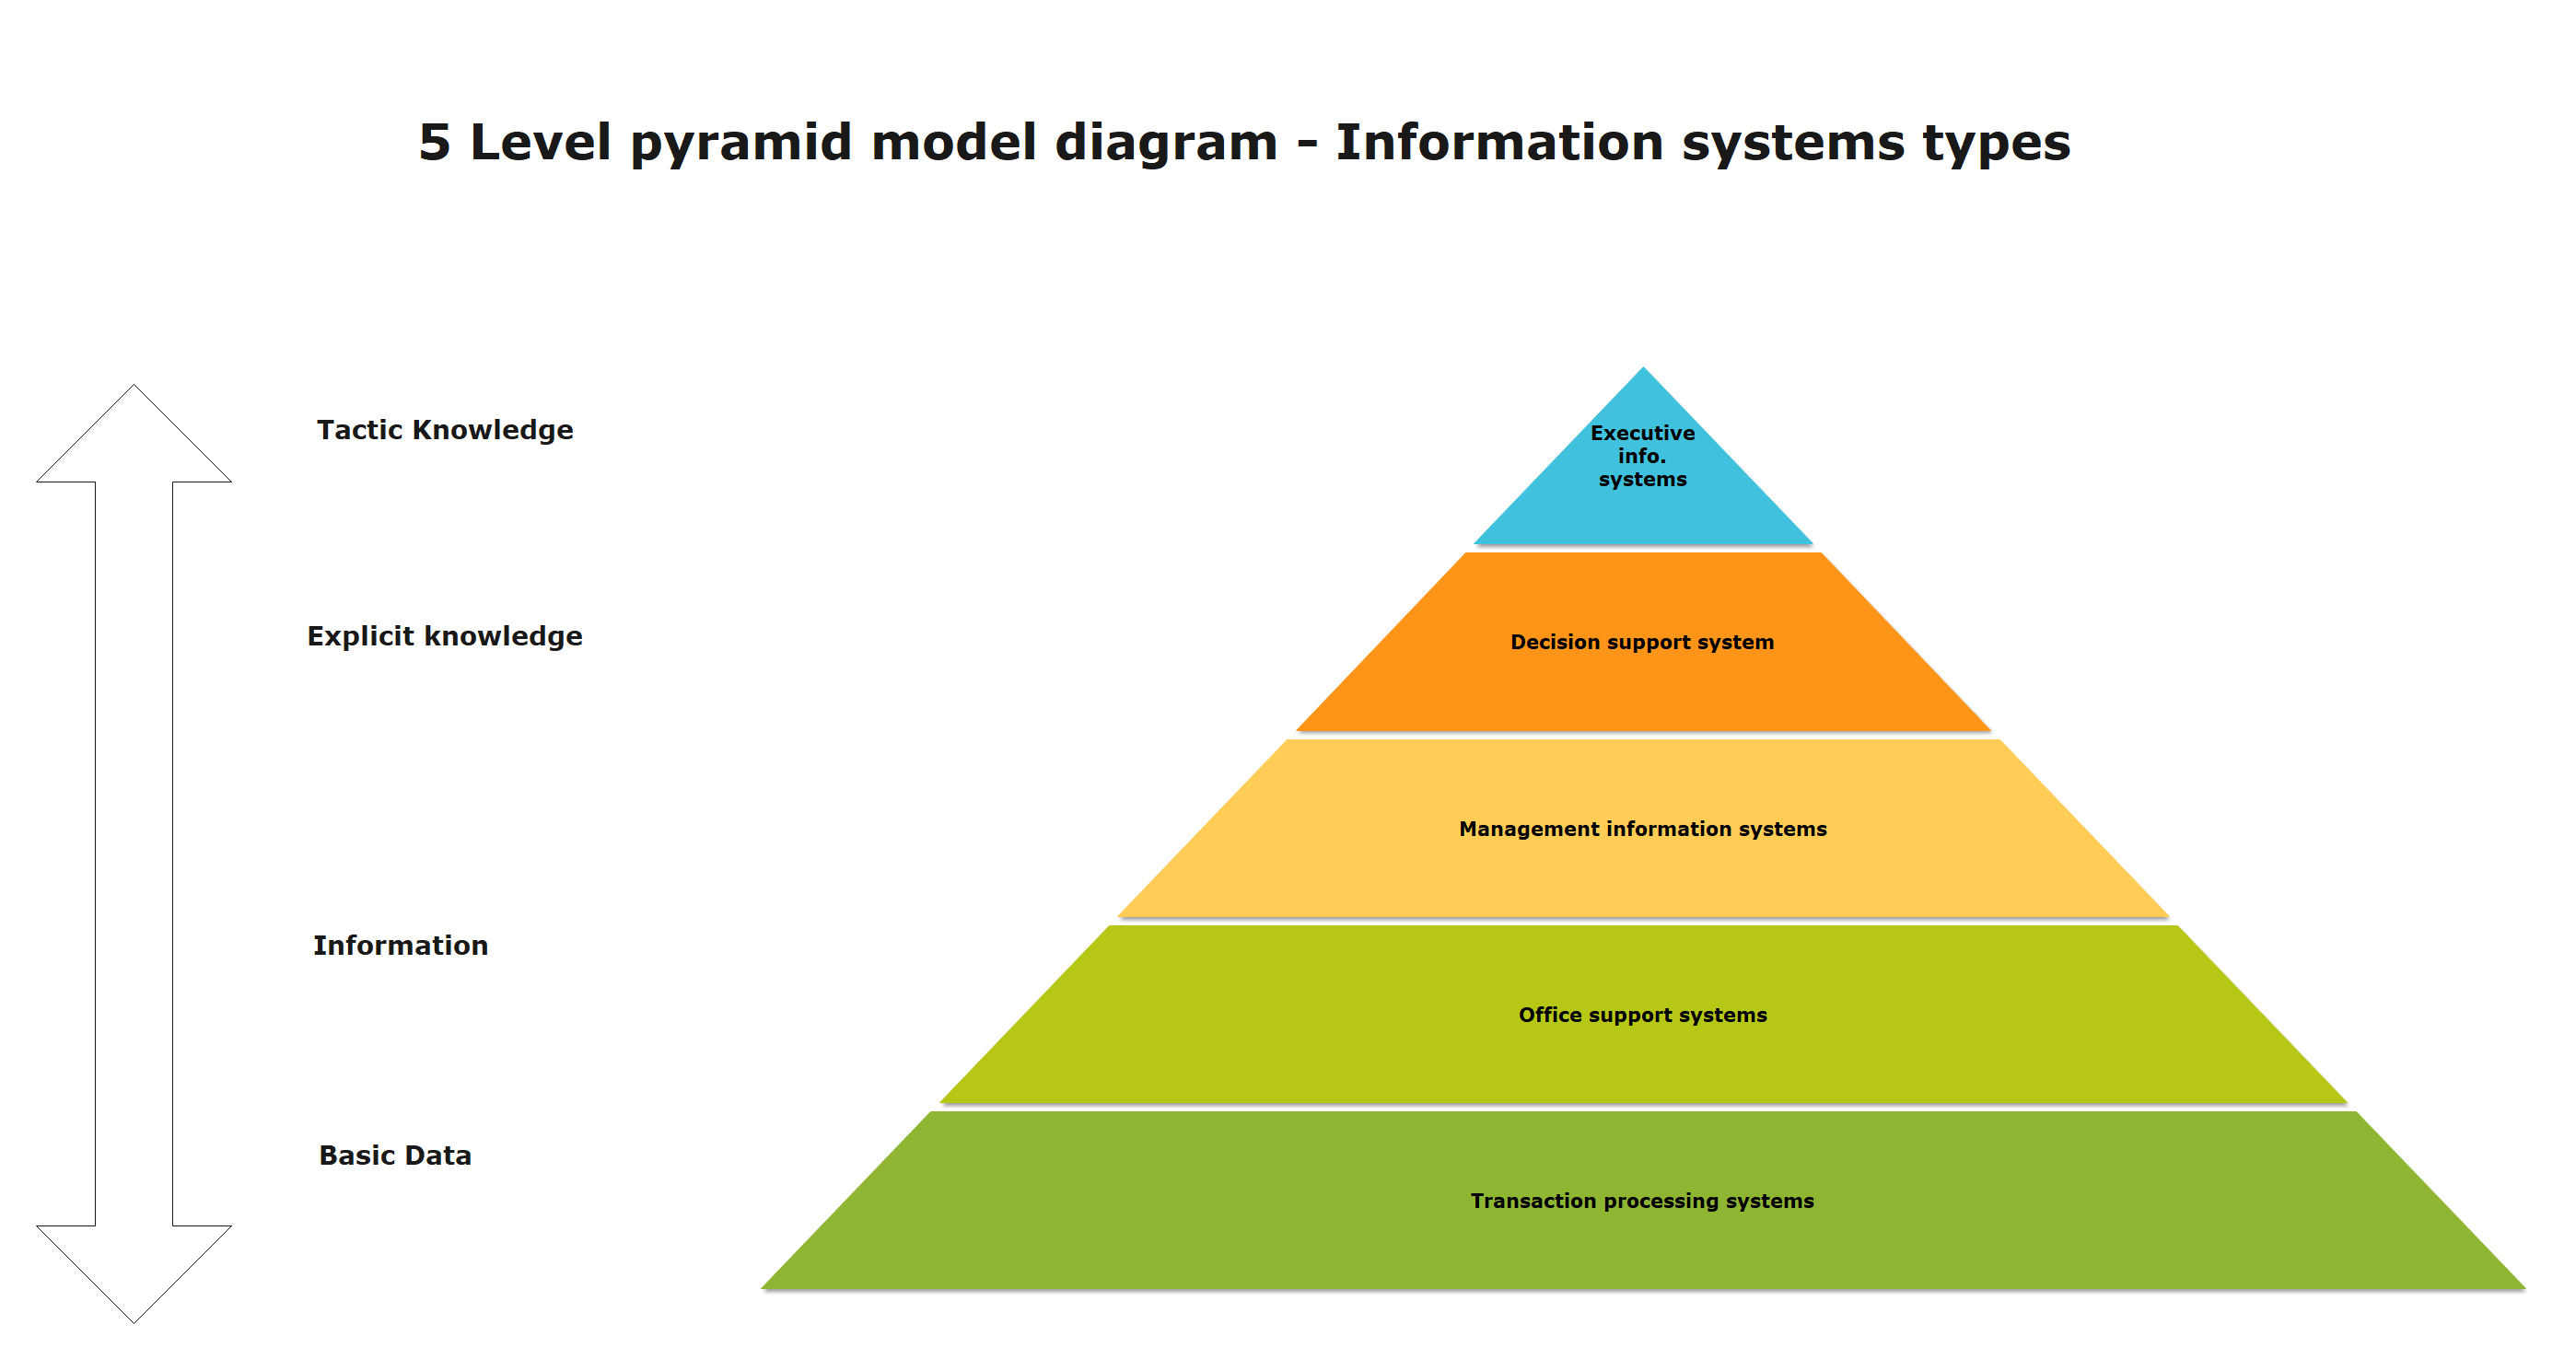
A pyramid model with five levels is one of the most straightforward business approaches to understand the flow of information in any system. The first level represents transaction processing systems to process primary data. The second level represents the office support systems to process information in any office or organization. The third level of the pyramid model represents management information systems to process information by managers. The fourth level represents decision support systems to process explicit knowledge. The fifth and last level represents the top-cycle of the hierarchy.
Part 4: Conclusion
According to this article, there are mainly three parts to illustrate what is pyramid diagram, to tell you how to create a pyramid diagram easily, and to show you some pyramid diagram examples. Generally speaking, pyramid diagram is applied to present data based on a foundation. Usually, the top of the pyramid represents data which are more desirable than that on the bottom. The proportional and hierarchical relationships can be laid out clearly in it.
EdrawMax is an easiest all-in-one diagramming tool, you can create pyramid diagrams and any other type diagrams with ease! With ready-made pyramid diagram symbols and cliparts, making pyramid diagrams could be as simple as possible. Also, it supports to export your work in multiple formats and share your work with others. Get started to create your pyramid diagrams now!


