How to Make an Arrow Diagram
Part 1: What is Arrow Diagram?
Arrow diagrams are used to determine the optimal sequence, and interconnectivity, of a sequence of events in a task or project.
Arrow diagrams are typically used when you need to closely monitor the timing of a task or project. It allows you to figure out how much time each step in a process needs. More importantly, it allows you to determine what the most optimal path to completing a project is. This allows you to cut out redundant steps in a process, or redirect more resources to another step that could benefit from the extra boost.
Part 2: How to Make Arrow Diagram?
Step 1: Start EdrawMax.
Step 2: Navigate to [New]>[Basic Diagram]>[Arrows Diagram].
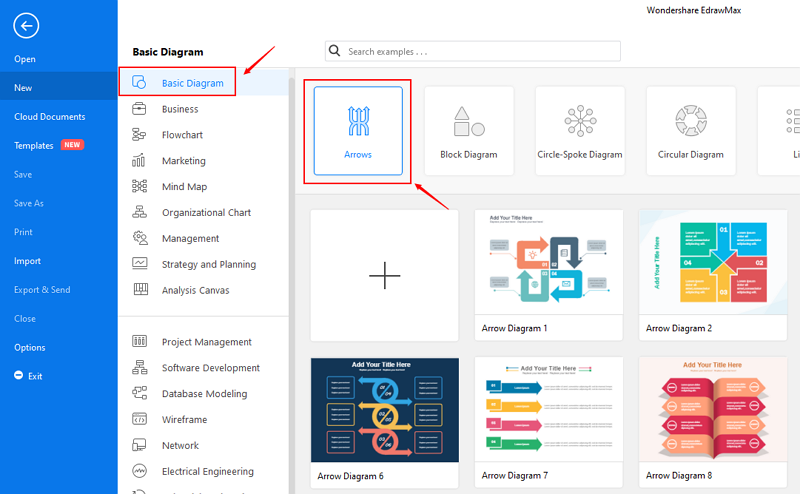
Step 3: Select one Arrow Diagram template to edit on it or click the [+] sign to start from scratch.
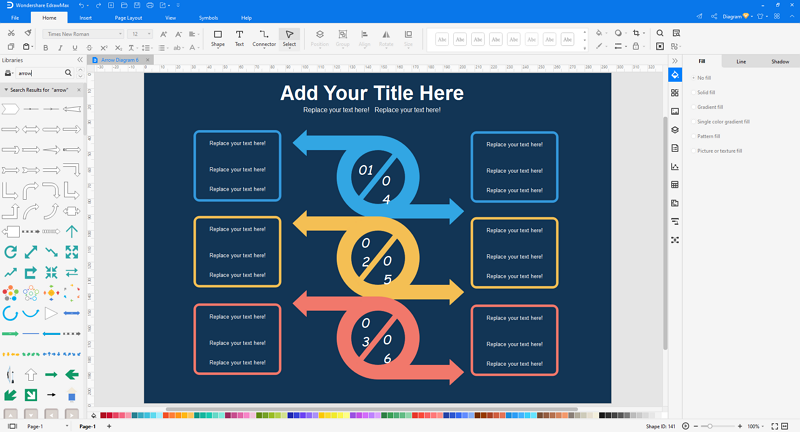
Step 4: You can export the file to Graphics, PDF, editable MS Office file, SVG and Visio vsdx file.

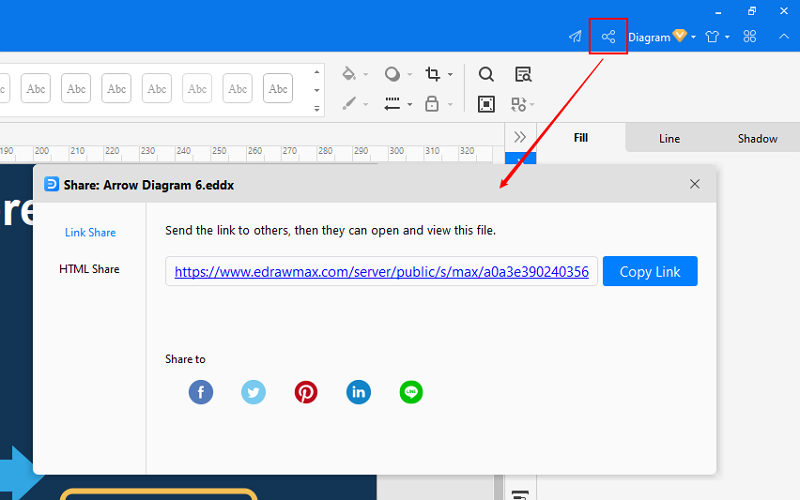
Step 5: And you can share your diagram with others via social media and web page.
Part 3: Arrow Diagram Examples
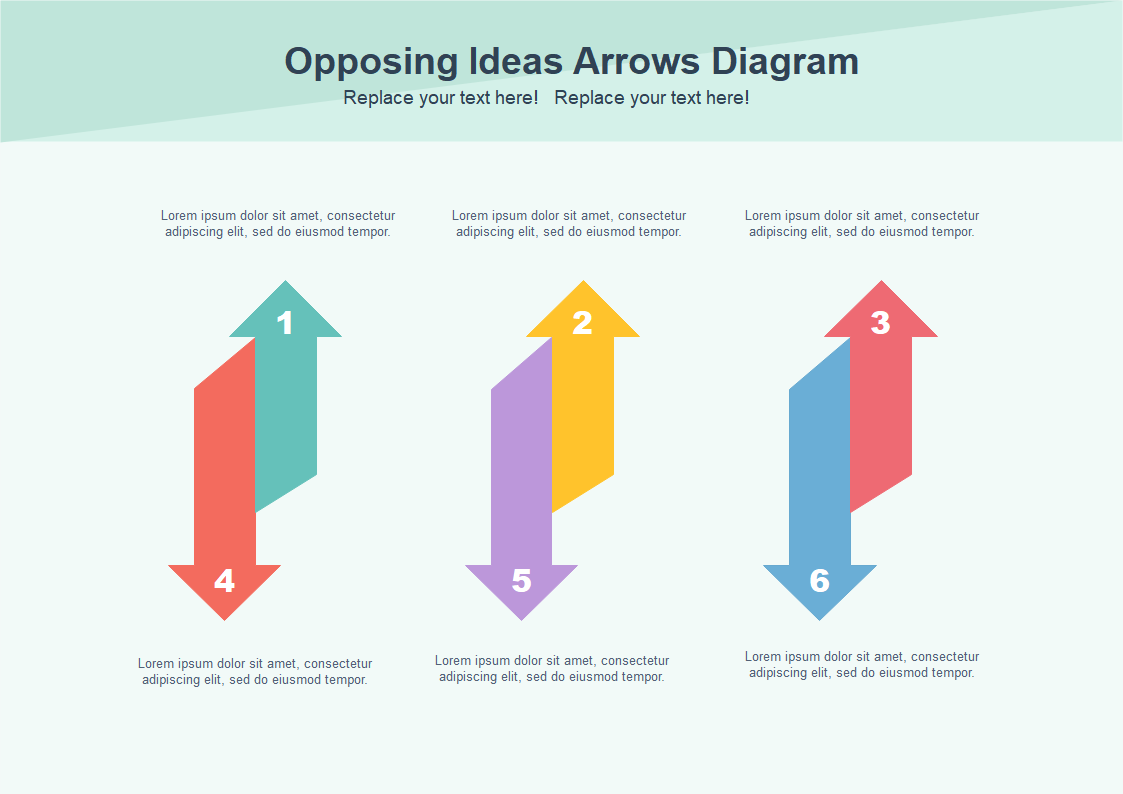
Example 1: Opposing Ideas Arrows Diagram
An arrow diagram is defined as a process diagramming tool used to determine the optimal sequences of events and their interconnectivity. A multipurpose arrow toolkit is created with shapes that help one understand the flow of how an IT-company works on any product and the steps involved in it.
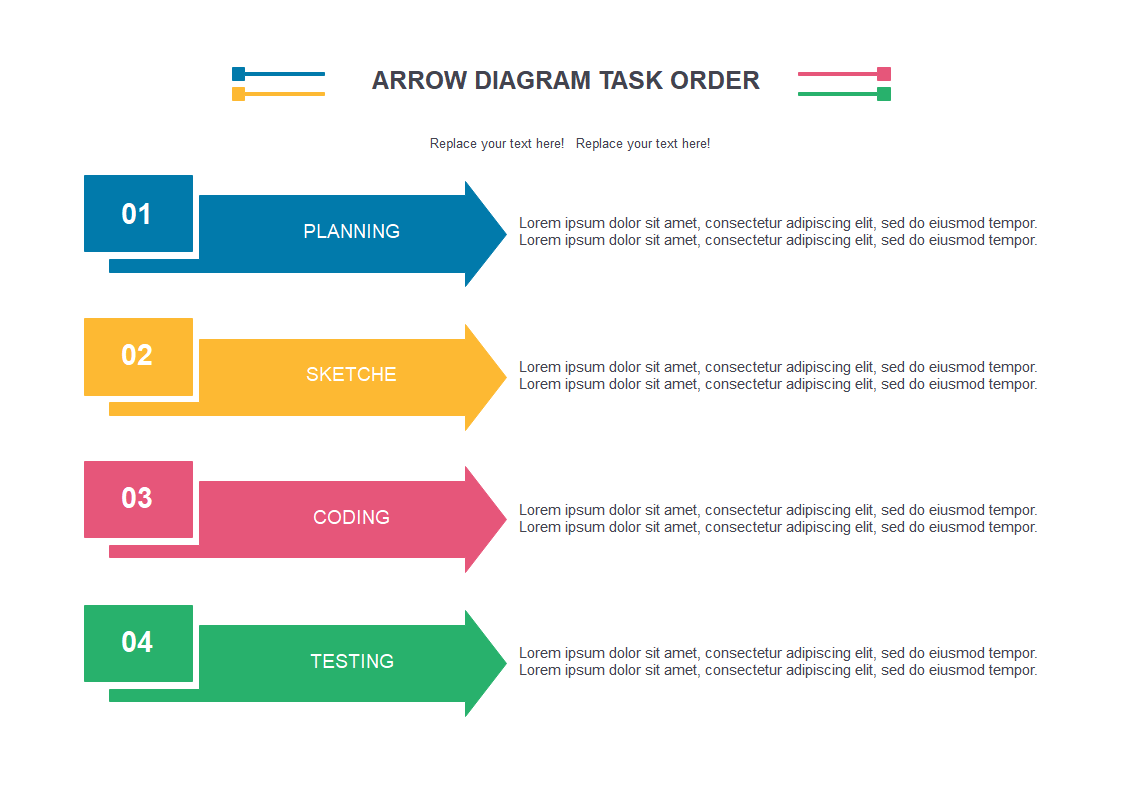
Example 2: Arrow Diagram Task Order Template
An Arrow Diagramming Method is a network diagramming technique in which several activities are involved. Several activities on node or precedence diagram methods are often favored over ADM, but the 3D arrows can better represent the task orders.
