Difference Between Line Charts and Scatter Charts
What are Line Charts and Scatter Charts
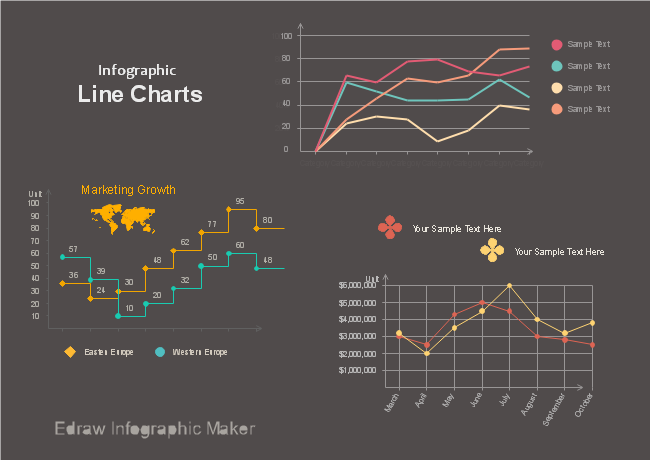
Line charts are generally used for explaining trends over a period. X and Y axes in a line chart show numeric values for different factors. Line charts are very clear for checking growth in a specific trend for individual data group. Employers may use such charts to analyze long-term trends of business statistics. Scatter charts are good for analyzing the difference of 2 to 3 factors over a period, and this type has some different elements: markers, points, and straight lines. All these elements represent specific data units.
Line Charts or Scatter Charts - Main Differences
These two types of charts record data information on both X and Y axes. However, it is not easy to select between line and scatter charts since they are very similar especially when scatter charts are showing connecting lines. Here are some significant differences in the way these two types of charts presenting data.
Differences in Axis
The horizontal axis, which is also known as the x axis, displays both numeric or non-numerical factors like hours or days in a scatter chart. In contrast, the X axis of a line chart can only show texts, which usually refer to non-mathematical data, at equally spaced intervals. In line charts date axes are in chronological order based on standard units even if the dates are not in order in your worksheet.
Differences in Purpose
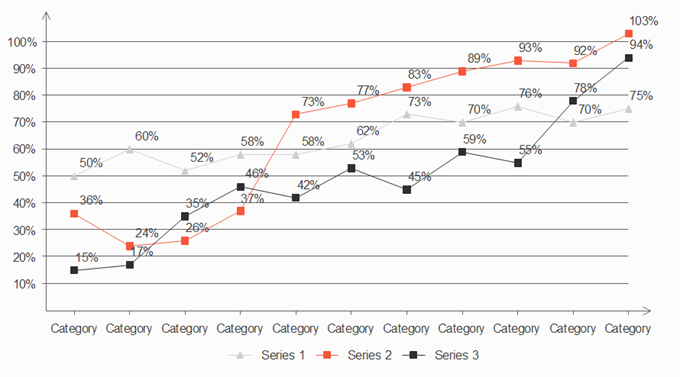
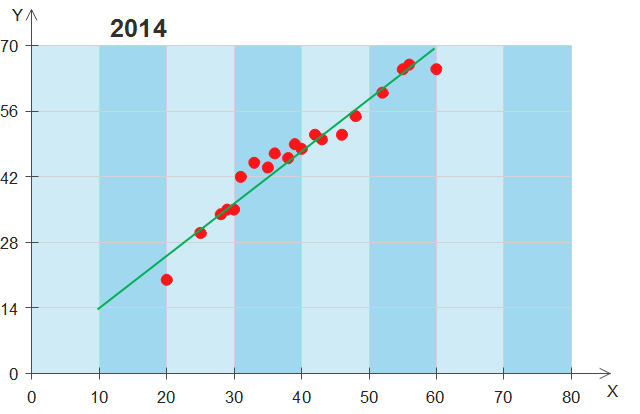
Before deciding which type to use, you should first think about these aspects: the total number of data points and variables you need to compare. Line charts are mainly for showing continuous data over a period, setting against a general scale and connecting individual data points together. Therefore such type is ideal for showing growth rate or trends at even intervals. For line charts categorized data are distributed equally along the vertical axis. Scatter charts are usually used for showing connections among different values in multiple data series, and comparing numeric values, such as scientific or statistical data.
Choose a Line Chart Rather Than a Scatter Chart If You
1. Use text labels on your X axis, which represent equally spaced values like a day, week or month.
2. Insert a few groups of mathematical labels on your X axis to show a specific time interval.
3. Use a time scale to set on your X axis to display different dates in chronological order at specific basic units. For example, the total number of days, months or years.
Choose a Scatter Chart Rather Than a Line Chart If You
1. Change the scale of your X axis. Keep in mind the X axis is always a value axis.
2. Use specific math functions, especially logarithmic numbers, on your X axis. In this case, you can easily transfer numbers into the logarithmic format on your X axis.
3. Show your original worksheet data that has more than one set of values. Feel free to adjust the independent scales of the X and Y axes to reflect more details about your values.
4. Indicate patterns on a large scale of data. In such case, it is very useful for illustrating the overall patterns of the data.
5. Do not want to consider time factors when comparing large sets of data points. The more data sets you insert in a scatter chart, the better comparison you can get.
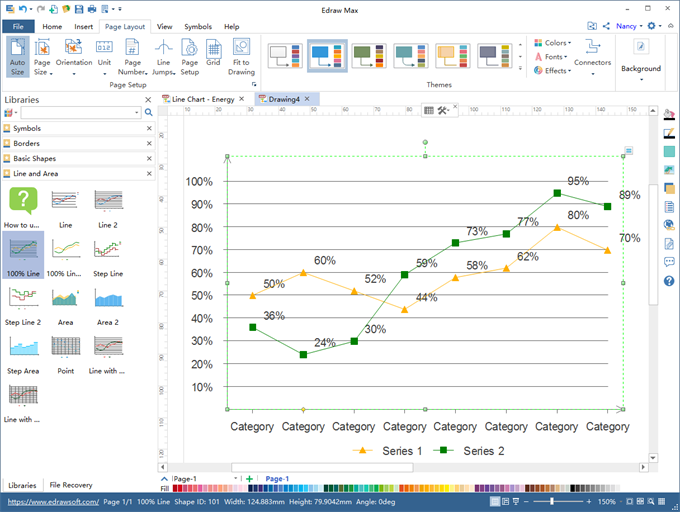
Try the Interactive Chart Software
The Edraw interactive chart maker has many preset chart templates for different categories like column, bar, pie, line, area, scatter, spider and gauges charts. You can also quickly import data from local files, or one click set different options like the category and series number, the legend and axis, the axis tick number and category interval etc.
Explore More
Top 10 Types of Charts and Their Uses


