Difference Between Fault Tree Analysis and Event Tree Analysis
Contents
Fault Tree Analysis (FTA) and Event Tree Analysis - Definition
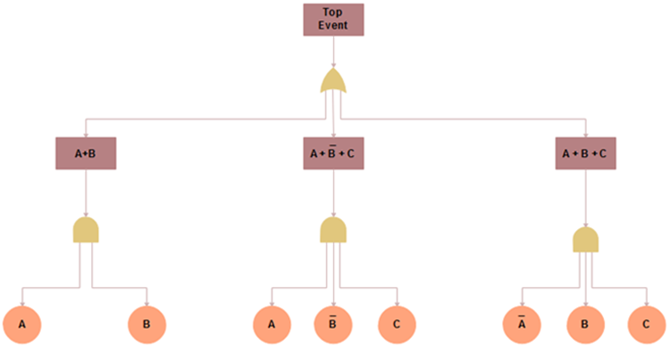
Fault tree analysis (FTA) is a kind of analysis and logic diagram for finding deductive failures in which using logic flows to combine different lower-level factors. It is also used for tracing all possible important factors and branches of events. Normally the more complex the case is, the more extensive the framework of fault tree framework will be. Here you can see an example of showing different pathways for possibilities.
Event tree analysis (ETA) is also a logical model for both failure and success responses from individual factor. The model has a number of pathways for analyzing probabilities of results and the analysis of the whole structure. Event tree analysis is used for checking the effects of functions, or any error systems. Here you can see an example of deciding the purchasing channel of software. You can choose different price categories with different payoffs, or borrow from your friends.

Differences in Logical Flows
The structure of fault tree and event tree analysis is different. The general direction of an event tree is from left to right laying on the horizontal axis, while fault tree graphs are shown in the up-to-down design. The layout of fault tree analysis is based on the traditional diagram structure of sciences, engineering or some other related subjects. In contrast, the structure design of event tree easily display categories with long titles and texts.
Differences in Analytical Units
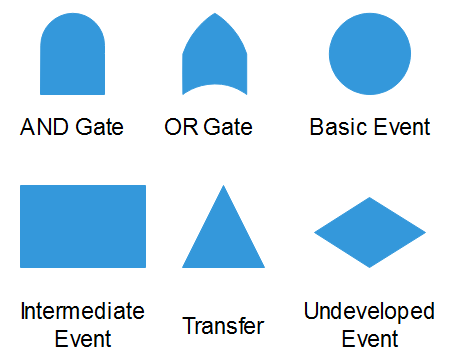
These two types of analysis have different units for presentations. Fault tree diagrams have 6 basic units and their advanced types are developed based on these fundamental ones.
AND Gate: It is used to represent the results of output factor only if all the input factors have been gone through.
OR Gate: This part is used to display the results of output factor only if at least one input factor has or have been gone through.
Basic Event: This one represents the very basic unit in a fault tree analysis.
Intermediate Event: It is a kind of fault tree factor that means at least one event happened in logic gates.
Transfer: This factor represents for the cases when the tree is developed into more branches with more options.
Undeveloped Event: This one is usually in a diamond shape to show a factor which has no more development due to the limitation of details.
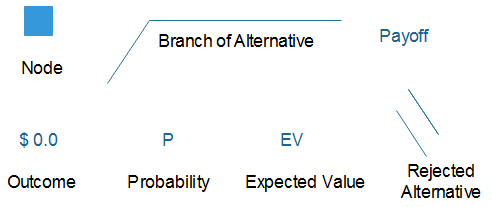
Analytical units of event tree analysis are easy to be classified. Normally these units including payoffs, branches, rejected alternatives, outcomes, probabilities and expected values.
Differences in Analytical Methodology
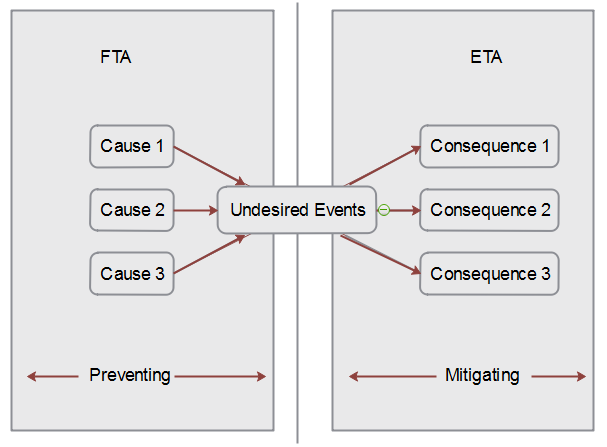
Although the diagram of fault tree and event tree analysis seem similar for some parts, there are still differences in terms of their analytical methodology. Both of these two types involve the identifications and classifications of events and factors, but with opposite focuses on undesired events. The main purpose of fault tree analysis is preventing losses. In contrast, event tree analysis is ideal for mitigating bad results. Or you can say, fault tree analysis is cause-oriented whereas event tree analysis is consequences-oriented. You can see the below diagram for more details.
Differences in Practical Uses
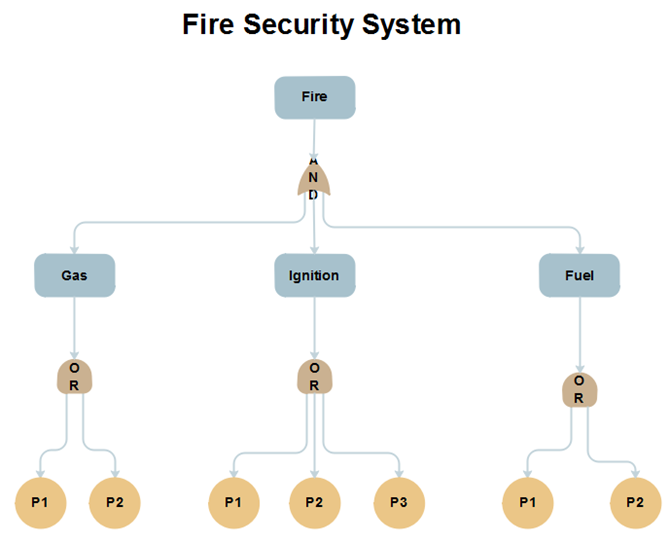
Both of these two types have helpful uses in reality for different specific fields. Fault tree analysis is ideal for the most of sciences related subjects, especially safety and reliability or software engineering, aerospace, energy, chemical process, pharmaceutical analysis, the design of diagnostic manuals and the fuel power design for aircraft. You can see a fire security system example below that based on fault tree analysis. P1, P2, and P3 are different probabilities for each pathway. In these cases fault tree analysis is mainly used for:
- Detecting technical bugs;
- Understanding the overall system framework;
- Optimizing existing resources;
- Identifying methods to decrease functional failures of systems;
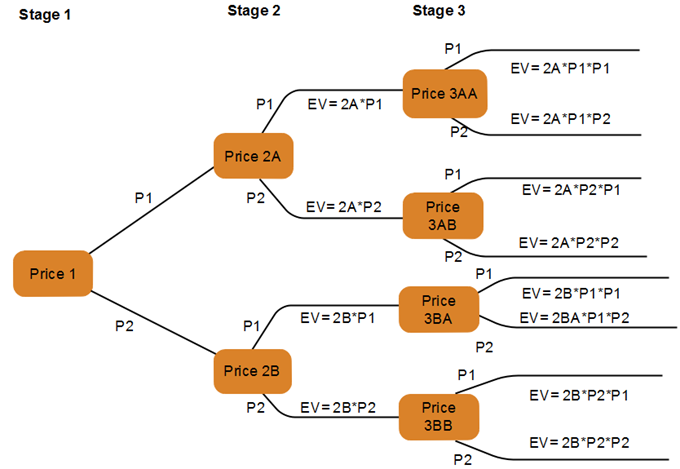
Event tree analysis is usually used for financial market analysis, especially those topics related to financial assets pricing and risk analysis. Readers can easily see the probabilities between different pathways of a financial model that based on event tree analysis diagram. Here you can see a financial pricing model sample for the practical analysis of stock pricing. For simplification, the probabilities in this example only have two values P1 and P2, and the total number of stages (time period) is 3. The Expected Value (EV) for each stage is the outcome of corresponding stock price times their own probabilities.
Fault Tree and Event Tree - More Tips for You
Procedures for creating fault tree and event trees both involve a number of key factors. Feel free compare each of them by yourself to see whether there is a significant difference in terms of your own project.
Tips for Creating Event Tree Analysis
- Identifying events and safety functions.
- Structuring the event tree.
- Setting classifications for results.
- Checking the probabilities for branches.
- Checking all results pathways for the overall tree
- Evaluating the tree based on practical uses for more details.
Tips for Creating Fault Tree Analysis
- Replacing any events of uncertain ideas.
- Classifying each event into more branches
- Finding any distinct results for each event.
- Checking any non-protective events.
- Checking cooperative results for each event
- Connecting different components in the tree
Diagram Software Recommendation
Easily create your own fault tree or event tree diagrams by using the powerful Edraw Max. Get inspired by choosing from the built-in professionally designed templates and dragging and dropping symbols. Customize every detail based on the smart auto-create tools. Once finished your work, simply benefit from the convenient file compatibility to export and share your drawing in many different formats, such as PDF, Word, PPT, JPEG, Html, etc.
Explore More
See What is Fault Tree Analysis
Create Fault Tree Diagram for Word


