8 Basic Diagrams for Teachers
In modern education, textbook and blackboard are not the only teaching medium. As visual communication tools, diagrams are more and more widely used when illustrating a new concept or preparing worksheets. Different diagrams serve for different purposes. Here we will introduce the most common ones, together with the editable templates that you can download.
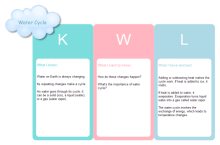
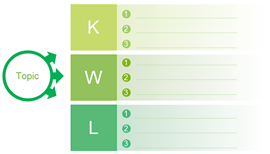
KWL Chart
KWL chart is popular because it helps students with effective learning. Generally, teachers use it as an instructive reading strategy in reading class. It has three columns listing the contents of "what I know", "what I want to know" and "what I've learned from this lesson". With a KWL chart, students can become more thoughtful and engaged readers.
|
|
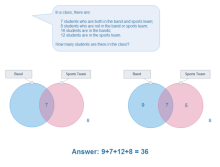
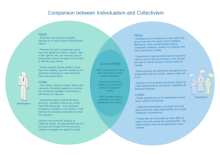
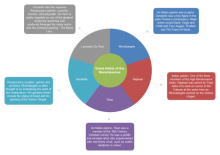
Venn Diagram
Venn chart is useful in various subjects. Math teacher use it to solve problems by categorizing data, while other teachers use it to compare, contrast items or classify concepts.
|
|
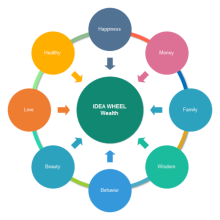
Ideal Wheel
Ideal wheel is used to display the main idea in the middle and the supporting ideas in the surrounding circles.
|
|
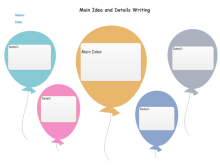
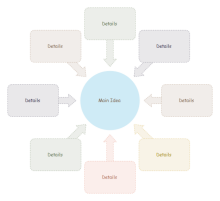
Main Idea and Details Chart
Main idea and details diagram shows the supporting details for a main concept. It is beneficial in helping students distinguish central ideas and their corresponding details from less important information.
|
|
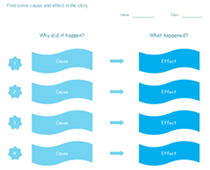
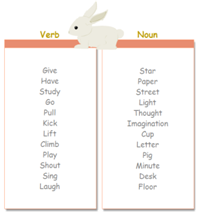
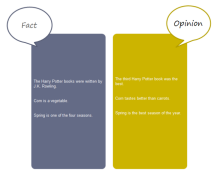
T Chart
T chart is a common diagram because it's used for compare and contrast two ideas. It's usually applied when presenting pros and cons, cause and effect, advantages and disadvantages, fact and opinions, or listing any topic having two viewpoints.
|
|
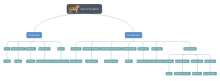
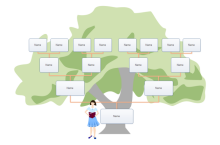
Tree Diagram
Tree diagram represents the hierarchical nature of a structure in a graphical form. For example, the animal classification tree chart, or family tree chart are very common to see.
|
|
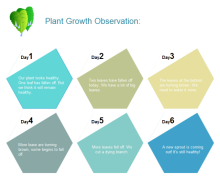
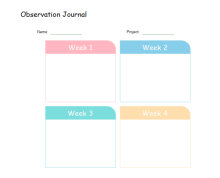
Observation Diagram
Observation chart is used to record natural phenomenon or experiment observations. It's always applied by science teachers. For example, student can use an observation chart to write down the changes of a growing plant weekly.
|
|
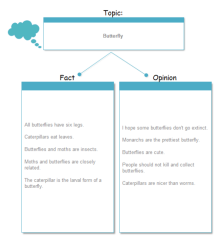
Fact and Opinion Chart
Fact and opinion chart is a kind of diagram to distinguish what is fact and what is opinion.
|
|

