15 Diagrams for Better Business Presentation
There is a huge variety of diagrams for business presentation out there. You have different choices for specific purposes. For example, if you are doing root cause analysis, fishbone diagram is correct to use; while if you are showing the company profile and history, it's better to use a timeline.
Below are 15 useful business presentation diagrams, almost all of which are very common to see in your work reports and meeting slides. Learn about these diagrams and make your future presentation more effective and engaging.
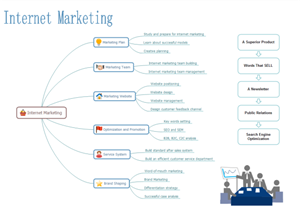
1. Mind Map
Mind map presents information in a highly organized way, which can easily assimilated by the brain. Therefore, when you prepare a presentation using mind map, it not only assists you organize the information coherently, but also helps audience understand your idea easier.
Free Mind Map Software
Tips for Making Effective Mind Map
Mind Map Examples
How to Create Mind Map
Mind Map for Problem Solving
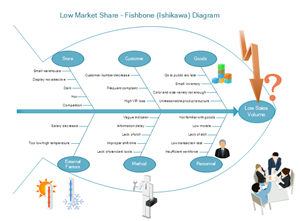
2. Fishbone Diagram
Fishbone diagram is a popular tool for root cause analysis in problem solving, which helps in brainstorming to identify possible causes of a problem and in sorting ideas into useful categories.
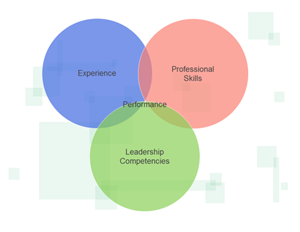
3. Venn Diagram
Venn diagrams are composed of several circles, with the overlapping parts in the middle indicating how much different groups have in common. Venn diagrams are often used in business presentations, showing the logical relations among groups.
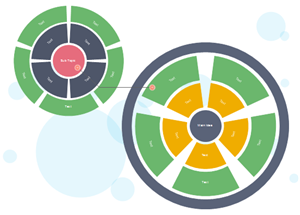
4. Circular Chart
Circular chart essentially displays the relationship of a central item and its stakeholders. Circular diagrams have been widely applied in business presentation.
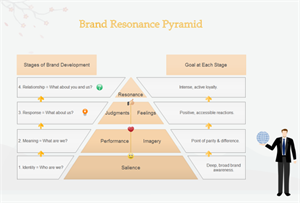
5. Pyramid Chart
Pyramid chart is a pyramid-like structure that shows both the hierarchical structure as well as the data. It has a variety of styles, including basic pyramid chart, inverted pyramid, 3D pyramid and gradient pyramid.
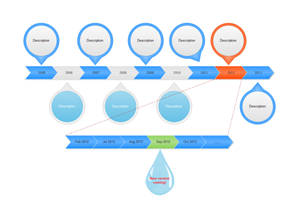
6. Timeline
Timeline displays a list of events in a chronological order. It's used to help people understand the order or chronology of historical events and trends for a subject.
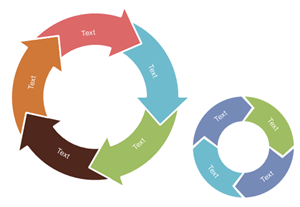
7. Arrows Chart
Arrows diagram is widely used to show the sequences and steps of a project or process. There are circular arrows diagram and linear arrows diagram.
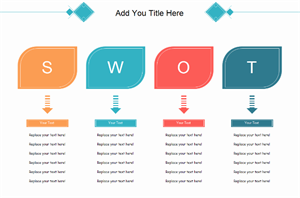
8. SWOT Diagram
SWOT is a straightforward model to identify your organization's strengths and weaknesses , as well as broader opportunities and threats. It's an effective method for understanding and decision-making for all sorts of situations in business.
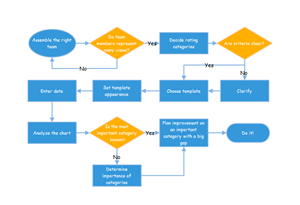
9. Process Flowchart
Process flowchart provides the graphical visualization of a process in sequential steps. It's simple way to help people quickly understand a process, which is very useful for business presentation.
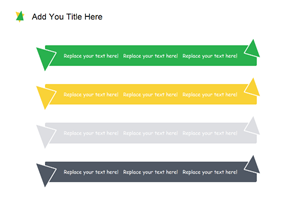
10. List Diagram
List diagrams present contents in separating blocks so that people can clearly identify the bullet points. List diagrams usually come in a variety of styles to attracts people's attentions.
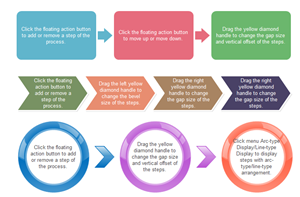
11. Process Steps Chart
Process steps chart use blocks and arrows to show the detailed steps of a process.
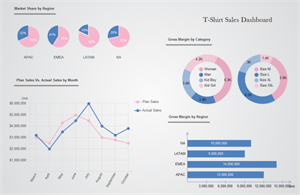
12. Charts and Graphs
Charts and Graphs are most common data visualization tools in business. They use graphical manner to condense large amounts of information into easy-to-understand formats that clearly and effectively communicate important points.
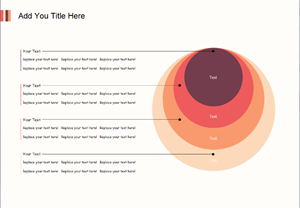
13. Onion Chart
Onion diagram is a type of circular diagram made up of concentric circles, which looks like the cross section of onion. Onion diagram is effective in showing layers of a subject.
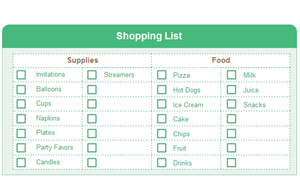
14. Checklist
Checklist collects a list of items with a check box in front of each piece marking its status. It can be used as a planning tool when you need to set up activity time schedule, or used to record essential things to buy or to remember.
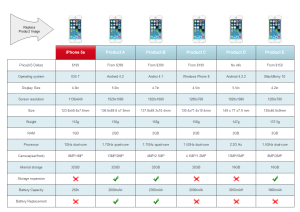
15. Comparison Chart
A comparison chart is a graphical summary of the comparison analysis. It's used to compare different items, such as brands, products, services, etc., in a group of aspects.
Download Edraw All-in-One Diagram Maker to Create Above Diagrams Effortlessly.

