How to Make a Venn Diagram
Part 1: What is Venn Diagram?
A Venn diagram is comprised of two (or more) overlapping circles. These two circles are used to show the relationship between the two things, items, individuals, or whatever class the circle is representing. The area where the two circles overlap represent things that the two classes have in common.
Venn diagrams are commonly used in education, primarily mathematics, to visually organize and identify relationships in sets of information. Beyond mathematics, they are useful in helping to identify the commonalities and differences in two or more sets of classes, which can come in handy when in comparing choices.
Part 2: How to Make Venn Diagram?
Step 1: Start EdrawMax.
Step 2: Navigate to [New]>[Basic Diagram]>[Venn Diagram].
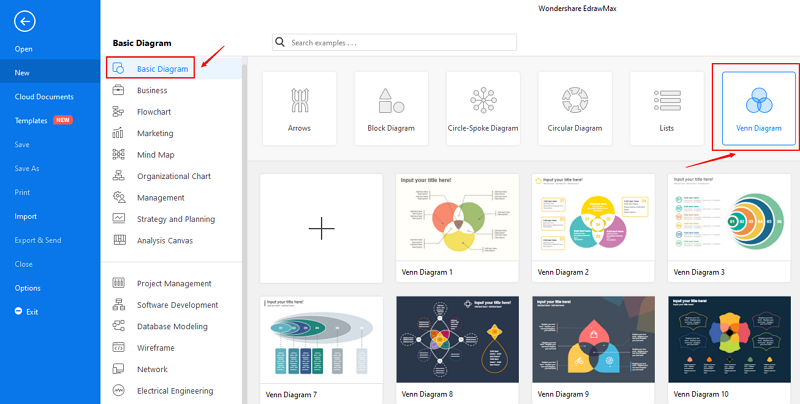
Step 3: Select one Venn diagram template to edit on it or click the [+] sign to start from scratch.
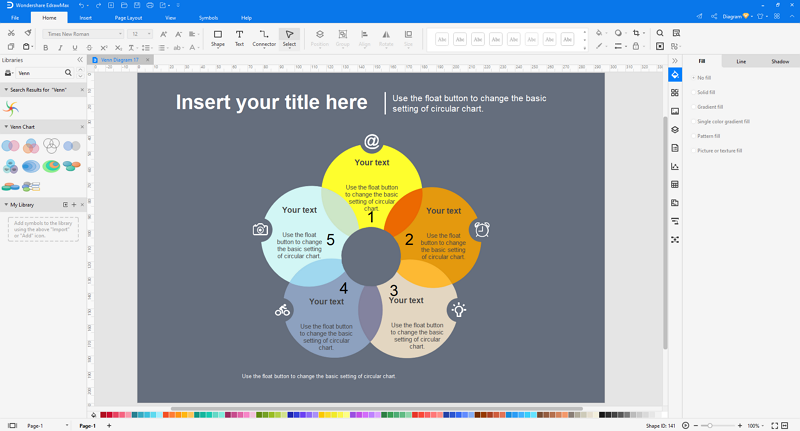
Step 4: You can export the file to Graphics, PDF, editable MS Office file, SVG and Visio vsdx file.

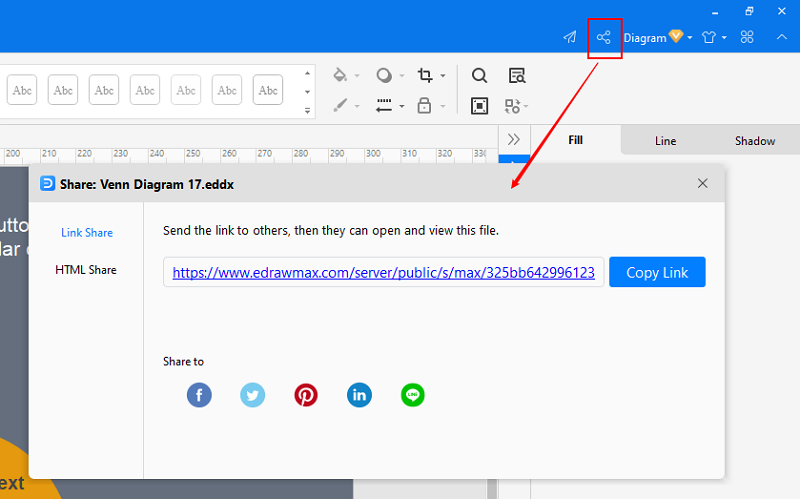
Step 5: And you can share your diagram with others via social media and web page.
Watch the video to learn how to create a Venn diagram.
If you have trouble in watching the video tutorial, please visit it at YouTube.
Part 3: Venn Diagram Examples
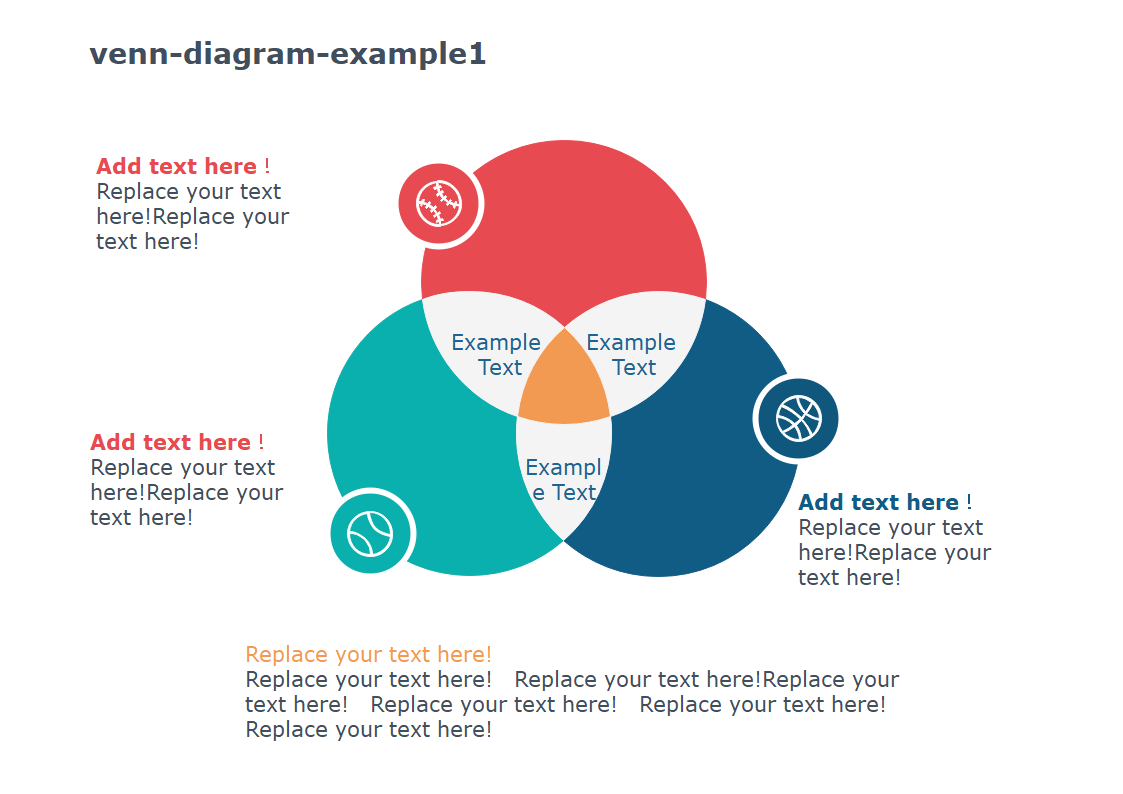
Example 1: A Simple Venn Diagram
Venn Diagram, also known as Euler-Venn Diagram, is a simple representation of sets by diagrams. Besides making data easy to digest and understand, Venn Diagrams offer two more benefits -- they highlight similarities lying in the intersection or where sets meet, and they show differences as evident from the areas in a set that don’t overlap with another set.
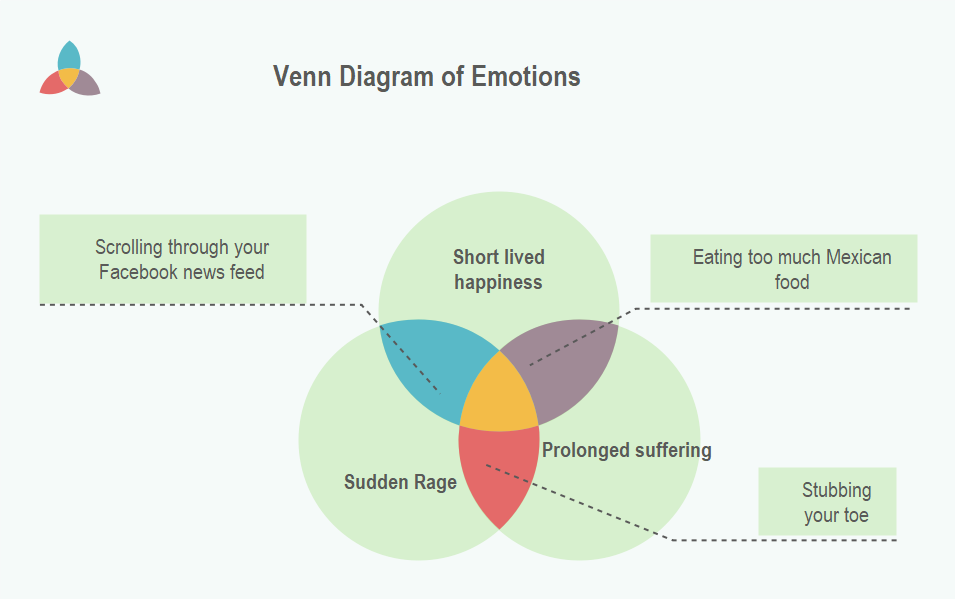
Example 2: Venn Diagram of Emotions
Venn Diagrams can be used to create humor maps that overlap specific situations. The Venn Diagram of Emotions provides a visual representation of problems that everyone is familiar with.
