Create Impressive Stacked Bar Chart Faster than Ever
A stacked bar chart displays the results of multiple queries stacked on top of one another. A stacked bar chart is an effective way to present the absolute values of data points represented by the segments of each bar, as well as the total value represented by data points from each series stacked in a bar.
Make Stacked Bar Chart in Easy Software
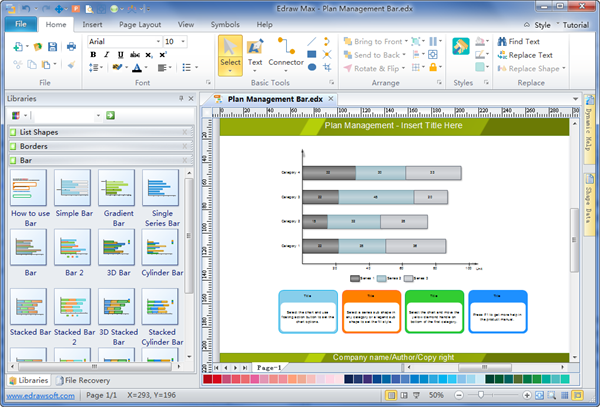
Only a few apps like Edraw, SVG and Flash charts support stacked bar charts. Edraw is a super easy tool to gain an impressive stacked bar chart faster than ever (5 minutes are enough). You can even create a unique stacked bar chart like no other. The drag-and-drop interface and ready-made template help you gain an impressive stacked bar chart as easy as pie.
Create Bar Charts from Readymade Templates
Edraw has included some blank stacked bar chart templates to ease the process. These templates are well-designed and fully editable. You don't need to bother about drawing bar and axis. Just input your data and description. It is that simple.
Stacked Bar and 3D Stacked Bar Chart Template

100% stacked bar and 3D 100% stacked bar

Draw a Stacked Bar Chart Amazingly Easily
Open the Bar Chart Template from the Chart library. Drag a suitable stacked bar chart template to the canvas. You can edit the template easily through the poin-and-click editor.
Edit Stacked Bar Chart Data
Double click value text on bar to edit the chart data, the bar width changes according to the rate of bar value and axis max value.
Note: In 100% stacked bar chart you cannot edit the bar percentage value directly. You need to select the category sub shape and drag the yellow diamond handle to change the bar width and percentage value.
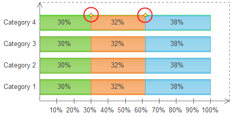
Change Chart Height
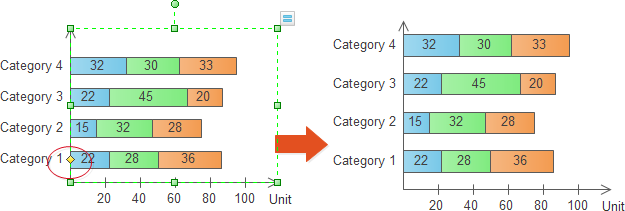
Select the chart > Vertically move the yellow diamond handle on the vertical axis.
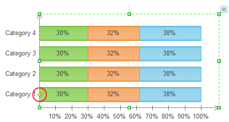
Set Bar Fill Style
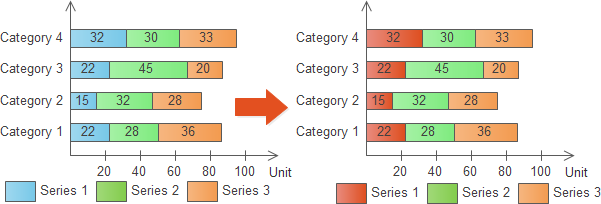
Select a series of sub shape in any category or a legend sub shape > Change the selected shape fill style, then Edraw applies the fill style to all of the series shapes.
Change the Category Interval
Drag the yellow control point up or down to change category interval. Alternatively, click Change the Interval on the floating action menu to set the value, the interval value should be greater than or equal to 0.
Build Stacked Bar Chart through Point-and-click Editor
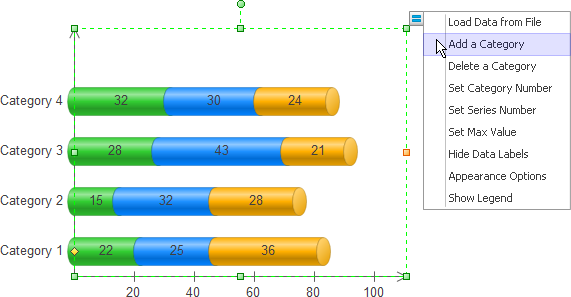
The built-in bar chart shapes are designed with easy point-and-click editor. This editor helps users make modifications extremely easily. Choose the shape, a floating button show. Rest the cursor over the floating button and then you can see its drop-down menu. See below.
Export and Share Stacked Bar Chart
When you complete the stacked bar chart, you can save it as the project file for revision later. You can print it or export it in the html, pdf, svg, transparent png format. You can also export it to MS Word, Excel or PowerPoint with one click on the Export button in the quick access toolbar.

Stacked Bar Chart examples
Here are 2 bar chart examples for your reference. If the topic is exactly what you need to illustrate, download it for free to present your ideas.
Stacked Bar Chart Example - Time Distribution
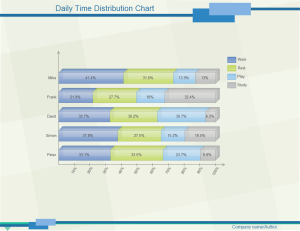
This chart will help present a fresh look for your presentation. Download and save the template for your future use.
Download Daily Time Distribution Templates in PDF Format
Download Daily Time Distribution Templates in Editable Format
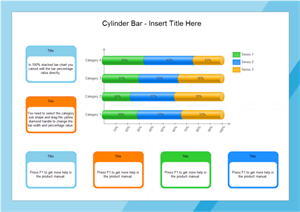
Cylinder Stacked Bar Chart
Nice bar chart example available to download and edit for your own use.
Download Cylinder Bar Chart Templates in PDF Format
Download Cylinder Bar Chart Templates in Editable Format
