How to Create a Scatter Plot
Part 1: What is a Scatter Plot?
A scatter plot is used to show the relationship between two sets of data. One set is labeled on the graph's vertical axis, and the other on the horizontal axis. Data points are plotted along with the graph as coordinates.
Scatter plots are commonly used in education and business. They allow you to determine whether patterns are linear or nonlinear, strong or weak, and positive or negative - or if there is no correlation at all. By identifying the relationship and correlation between data sets, you can predict their future behavior. This makes it especially useful for business users.
Part 2: Types of Scatter Plots
Scatter plots show the relationships among the numeric values in several data series, or plot two groups of numbers as one series of XY coordinates. Scatter plots have the following types:
XY Chart
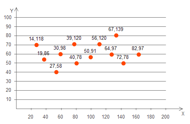
Scatter with only markers and scatter with line and markers
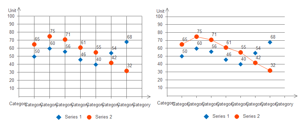
Part 3: How to Make a Scatter Plot
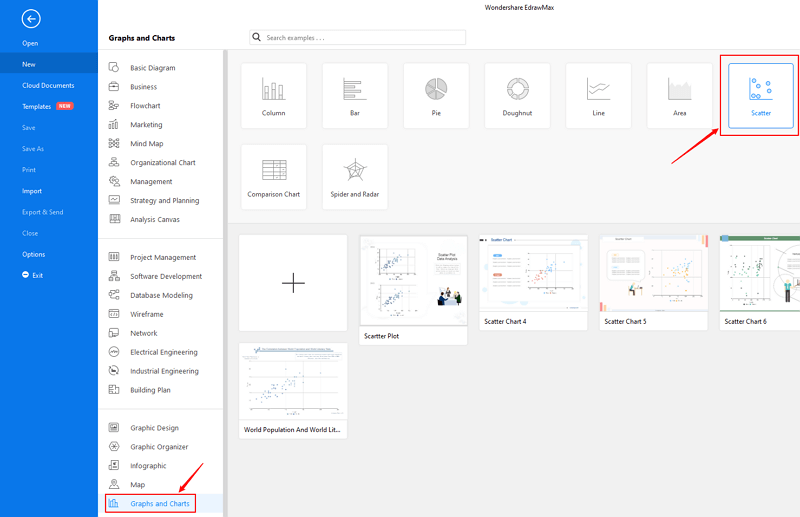
Step 1: Open EdrawMax from your computer, and navigate to [New] > [Graphs and Charts] > [Scatter].
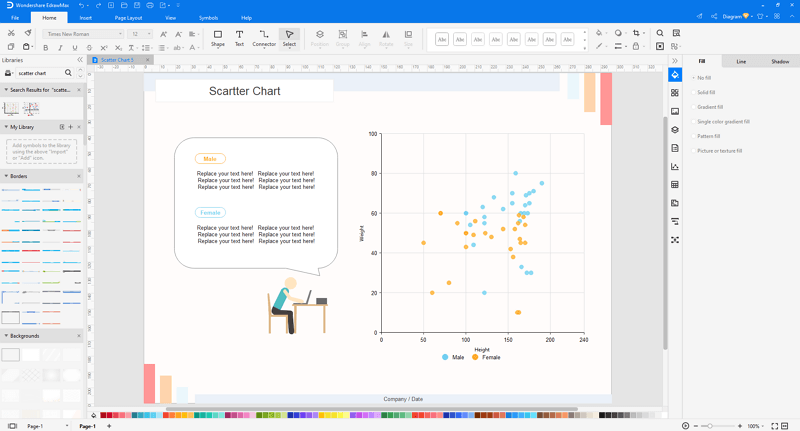
Step 2.1: Choose a pre-made template from the template gallery and open it. You will see the diagram on the canvas with a lot of editing tools on the top menus and right panes.
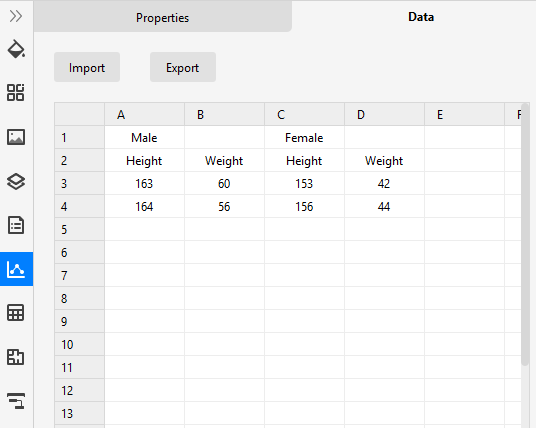
Step 2.2: After you open a blank scatter plot template or insert one on the canvas, you can import the data by uploading files (XLSX or CSV) or pasting the data on the windows.
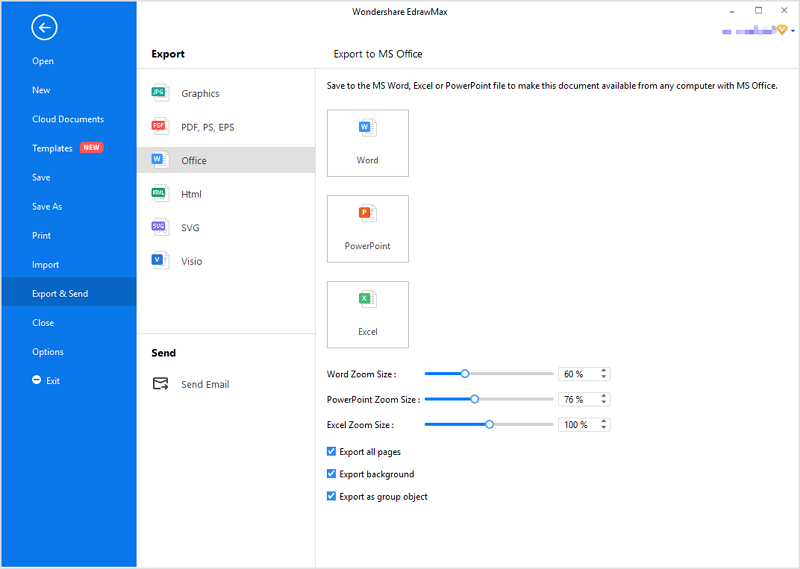
Step 3: You are able to save and export the chart to graphics(JPG, PNG), PDF, editable MS Office file format, SVG and Visio vsdx file format when you finish the design.
Step 4: You can also share your scatter plot with others via social media or sharing links. In addition, you can publish your chart into EdrawMax's online template gallery.

EdrawMax
All-in-One Diagram Software
- Superior file compatibility: Import and export drawings to various file formats, such as Visio
- Cross-platform supported (Windows, Mac, Linux, Web)
Part 4: Scatter Plot Examples
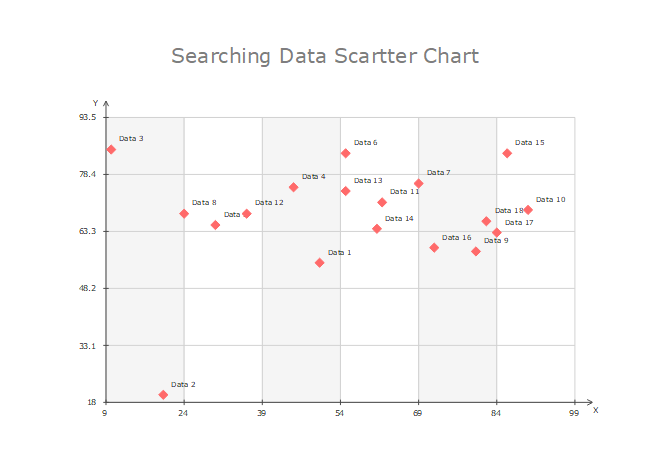
Example 1: Data Scatter Chart
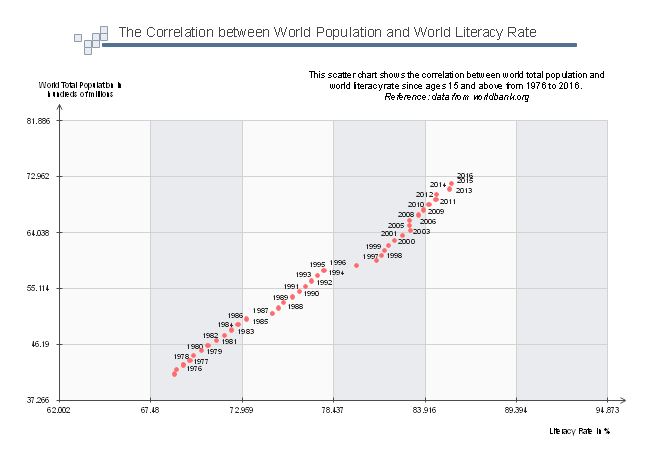
Example 2: World Population And World Literacy Rate
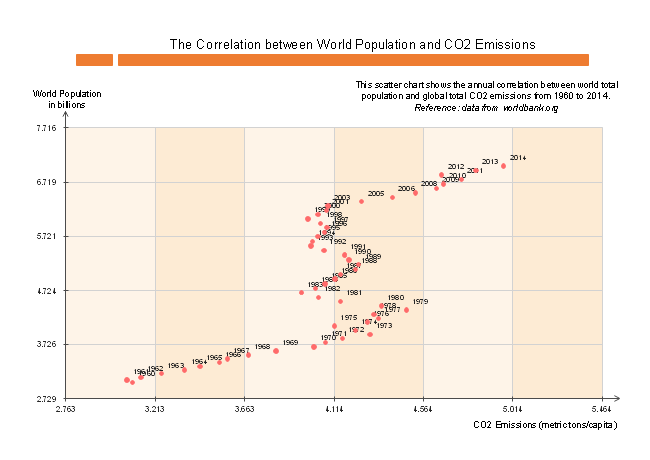
Example 3: World Population And Carbon Dioxide Emissions


