How to Create a Quality Function Deployment Chart
Step 1: Start-Up
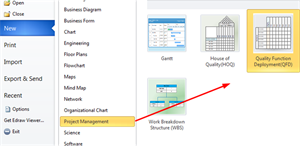
- Open Edraw, on the start page find Project Management category and double click QFD template to get into the drawing page.
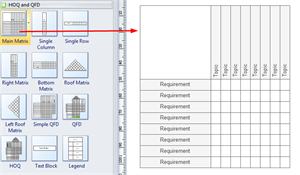
- Simply drag a matrix shape from the library, and drop on the drawing page. You can also drag a complete QFD template.
Step 2: Add or Remove Rows and Columns
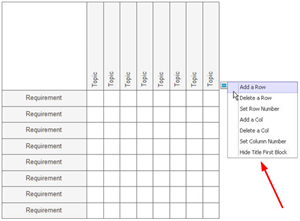
Click the shape and you will see a floating button, through which you can add or remove rows and columns.
Step 3: Change the Shape Size
1. Click the shape, and the green and yellow handles will show up.
2. Drag green handles you can change the size of the shape.
3. There are two yellow control handles, through the one on the top you can change the height and tilt angle of the upper part, while through the one in the middle you can change the size of the columns.
Step 4: Edit Labels of Rows and Columns
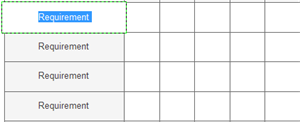
Add text to the rows and columns labels by double clicking the boxes and typing.
Step 5: Add Symbols
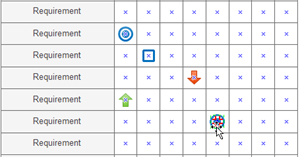
1. Drag a required symbol from the library and approach to the matrix shape, and each box will appear a blue X.
2. When the symbol gets to the right position, the blue X will turn red. Release your mouse, and the symbol will be glued with the box.
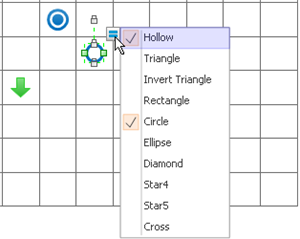
3. Each symbol has more than one styles inside, you can click the symbol and choose more options through the floating button.
4. The color of the symbol is changeable. Select a symbol and go to Home menu, Fill button to change the color.

More Related:
How to Create House of Quality Diagram


