How to Create a Pie Chart
Part 1: What is a Pie Chart?
A pie chart is a circular graph that shows the proportions of categories based on the size of each slice. The entire pie represents 100 percent, and each slice represents a portion of a whole.
Pie charts are used by business professionals, students, statisticians, and many others to demonstrate how groups or categories are broken down. Through this, comparisons between each slice can be made, which aids in statistical analysis.
A pie chart's strength lies in its simplicity. It visually represents data in a way that is easy for audiences of all levels to understand. Even if no numbers are used, information can quickly gleam, and a quick analysis of the data can be made.
Part 2: Different Types of Pie Charts
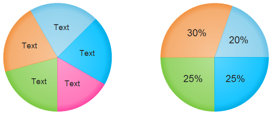
Simple Pie and 100% Percentage Pie Chart
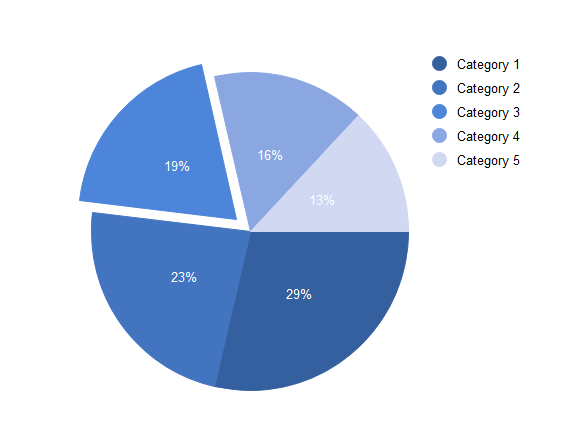
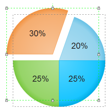
Exploded Pie Chart
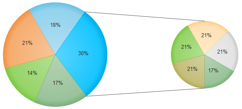
Pie of Pie Chart
Part 3: How to Create a Pie Chart
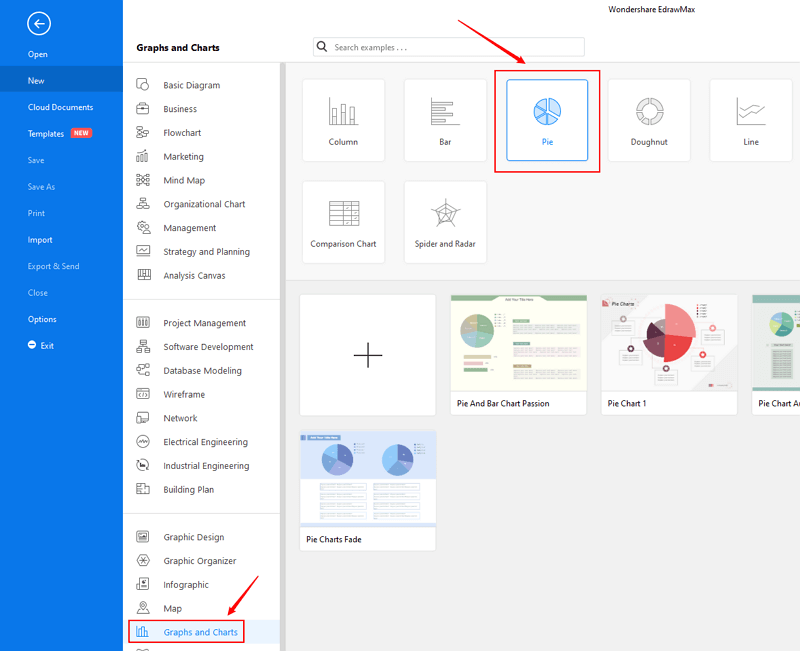
Step 1: Open EdrawMax from your computer, and navigate to [New] > [Graphs and Charts] > [Pie].
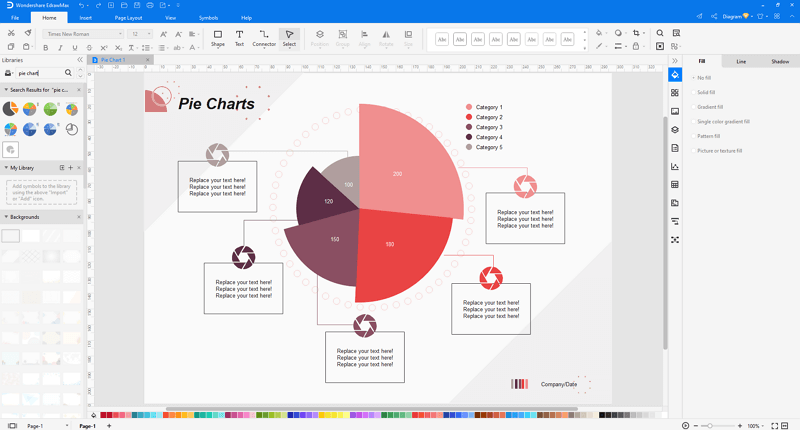
Step 2: Open and make modification on a pre-made pie chart template, or you can create a new pie chart with preset smart shapes and chart editing tools,
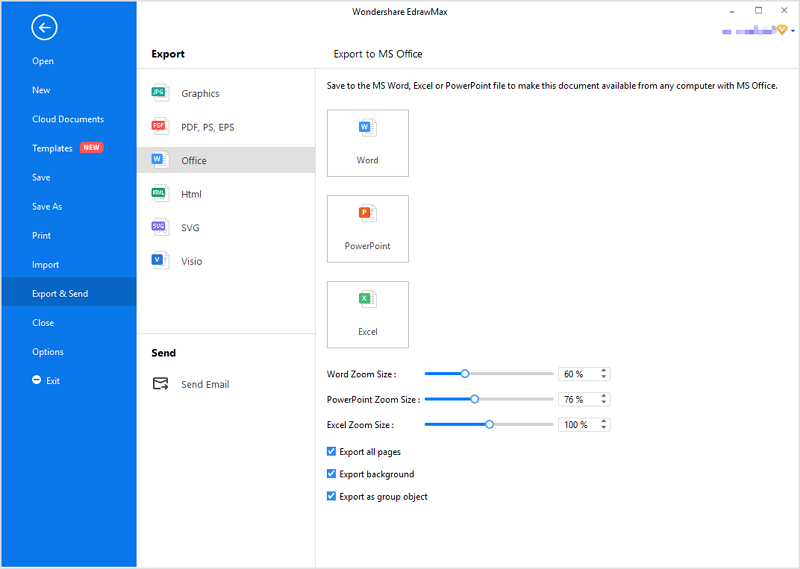
Step 3: When you have made the pie chart, you are able to save and export the diagram to graphics(JPG, PNG), PDF, editable MS Office file format, SVG and Visio vsdx file format.
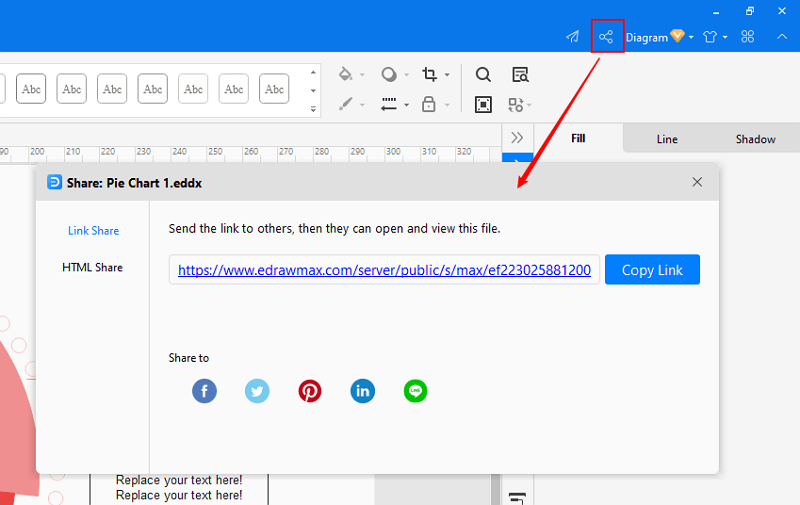
Step 4: Alternatively, you can share your pie chart via social media and sharing links. In addition, you can publish the pie chart into EdrawMax's online template gallery.
art 4: Tips to Improve Pie Charts
- 5 is usually the maximum number of slices to use in a pie chart or it will be too complicated.
- If there is no other meaningful order, order the slices from maximum to minimum; Put "other" in a gray slice;
- Labeling the slices is more readable than using a legend.
- Use an independent pie chart in a supporting role for a more complex chart;
- Use appropriate color codes to differentiate groups of slices;
Part 5: Pie Chart Examples
Example 1: Seperated Pie Chart
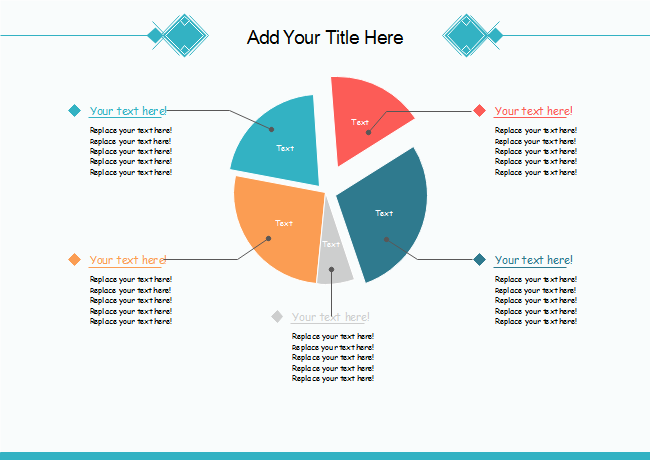
Example 2: Marketing Plan Pie Chart
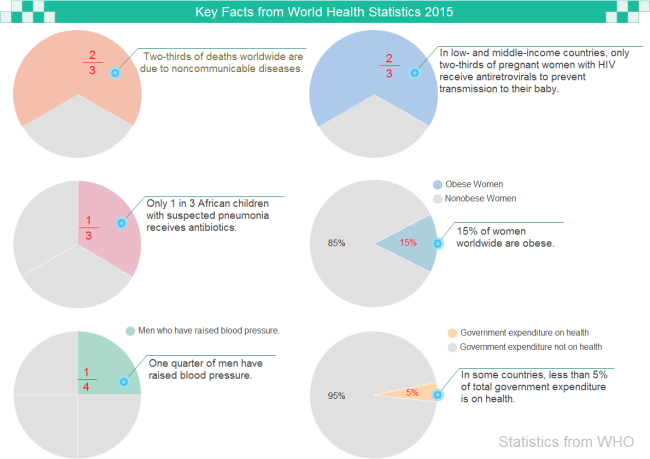
Example 3: Health Facts Pie Chart


