How to Create a Multi-Level Circular Chart
This tutorial will show you how to make a multi-level circular chart out of the circular symbol (template) in the predefined library. It's really easy if you get the techniques.
1: Use The Correct Circular Symbol
In the Circular Charting Shapes library, you can see a great variety of circular shapes for different purposes. Which one is the best to make multi level circular chart?
Usually we will use the Circle 6 for multi-level circular chart.

2: Edit the Symbol (Template)
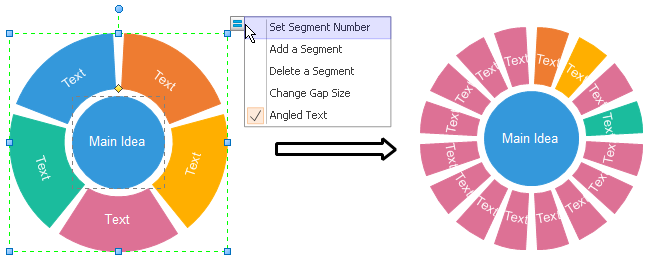
1. Set Segment Number for the Ring
Select the shape, and click again on the ring you want to set. Then a floating button will appear on this ring. Click the floating button and choose "Set Segment Number". Input a number in the pop-up window.

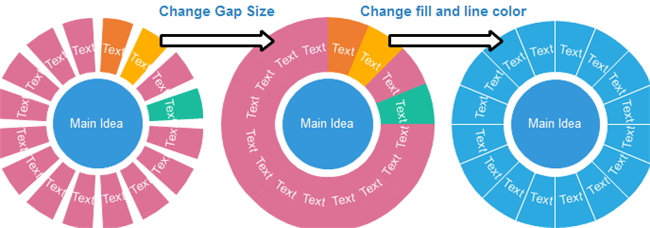
2. Change Gap Size and Fill with a Color
From the same floating button, click "Change Gap Size", and input "0" on the pop-up dialogue.
Apply a color for the ring, and set the line with white color.

3: Add More Rings and Change Ring Size
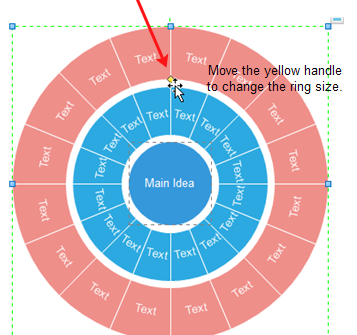
Select the shape, and click the floating button on the top right corner of the center circle. Choose "Add a Ring" to add more rings.
Select a ring, and move the yellow control handle to change the ring size.

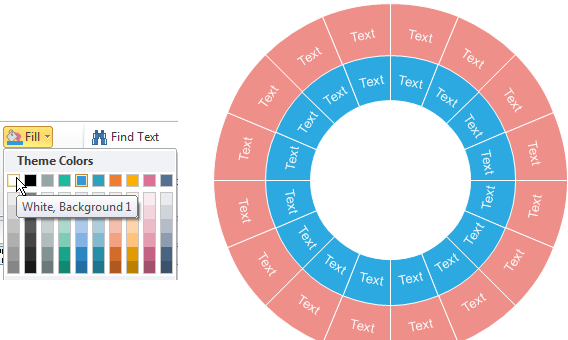
4: Hide the Center Circle by Filling with White Color
If you want to hide the center circle, simply fill it with white color.

Download Edraw and see how quickly and easily you can make Circular Chart.

